
Undoubtedly Microsoft Excel is amongst the best tools for increased productivity in our workplace today. Microsoft Excel helps workers perform their assigned tasks easily. The use of Microsoft Excel has greatly improved productivity in organizations. It offers a quicker way to complete your task effortlessly. Many organizations now sort after Men and Women with good skill in Microsoft Excel.
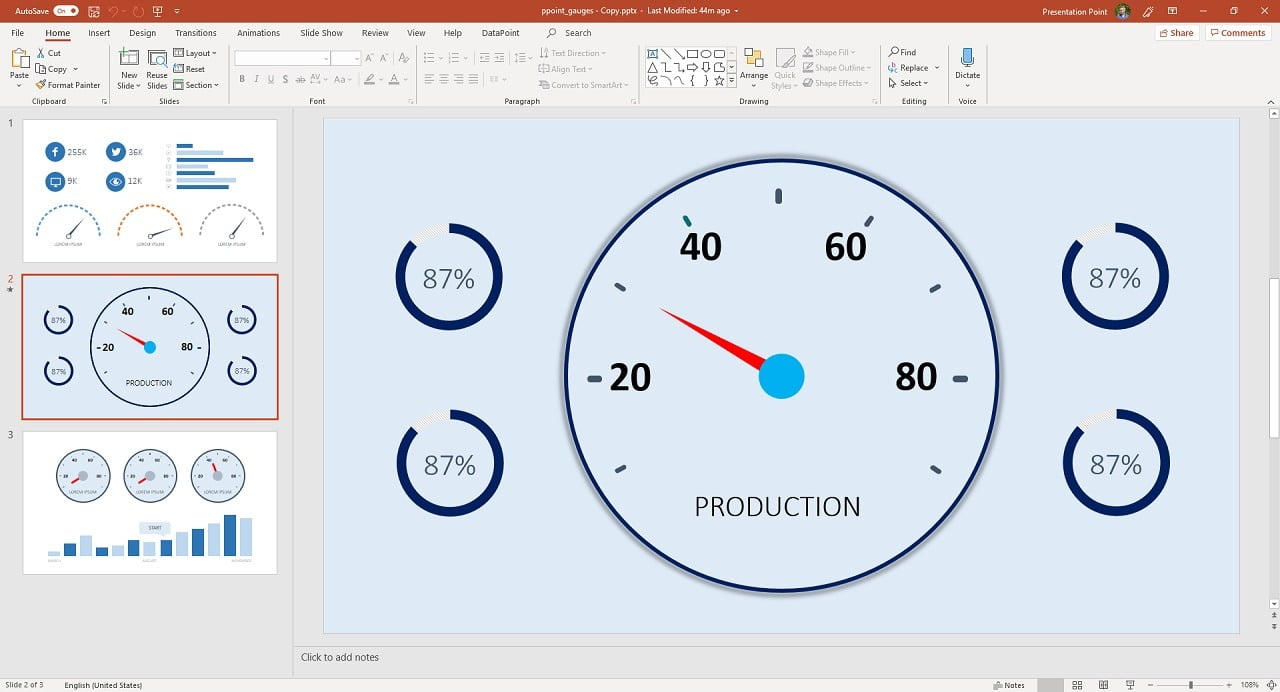
PowerPoint is another outstanding program that enhances business excellence. PowerPoint offers a clear understanding and interpretation of data. It has a unique display setting that makes the audience appreciate the program, but it is static.
Some persons believe PowerPoint to be superior to Excel and vice versa. But recently, people create PowerPoint from Excel data. Excel is used for computations because it has a lot of data needed for the report. PowerPoint will help enhance the appearance of these reports. So, simply present your result in PowerPoint after all calculations from your Excel.
Displaying Microsoft Excel Data
PowerPoint is ideal for Data presentation, but when there is the need to display numbers, it is best done on a spreadsheet. It’s easier to enter raw data and make calculations on Microsoft Excel. However, the display of these data on Excel may appear unappealing to viewers. So, it is better to make use of PowerPoint for your final presentations instead.
There is an advanced tool called DataPoint that will help bring out the best of your result in PowerPoint. You can use DataPoint for mail merging and multiple document generation. Once you plugin DataPoint, it will update anything and everything automatically at every given point with no mistake.
For instance, if you want to present a piece of live display information comprising of words, numbers, and even pictorial display. You’ll simply use Excel to compute numbers and figures, and PowerPoint for pictorial effects. To display your end information result, all data should appear in a single presentation. The DataPoint tool will make this easier to achieve as it, allows you to create dynamic presentations for superiority.
To present these live data, some persons tend to copy objects from Excel and paste directly to PowerPoint. This is a very wrong method. If you’re looking for professionalism, then its best, you do not follow this method. The grid lines from Excel will remain visible, and this may appear unprofessional in your final presentation. Your system will not support the update of information automatically over the network.
For the best presentations, use only the data on Excel, and do the formatting in your PowerPoint presentation. You can export from Excel to PowerPoint as images, or better reproduce charts and tables in PowerPoint.
How to easily Display live information on PowerPoint from Excel
You can display live information’s from your spreadsheet to PowerPoint and also update to real time using DataPoint. To achieve these, you must first;
- DataPoint Installation: you must download and install DataPoint
- After installation, a menu will appear in PowerPoint, Click the DataPoint menu
- Next, you will click the list button of the connections group
- Then locate the Excel file and click add a connection
- Next, you browse to the Excel file you want to use and click OK
- Then, rename the connection to any given name of your choice
How to Connect to your Excel Worksheet
- To connect to a given worksheet, click add Query
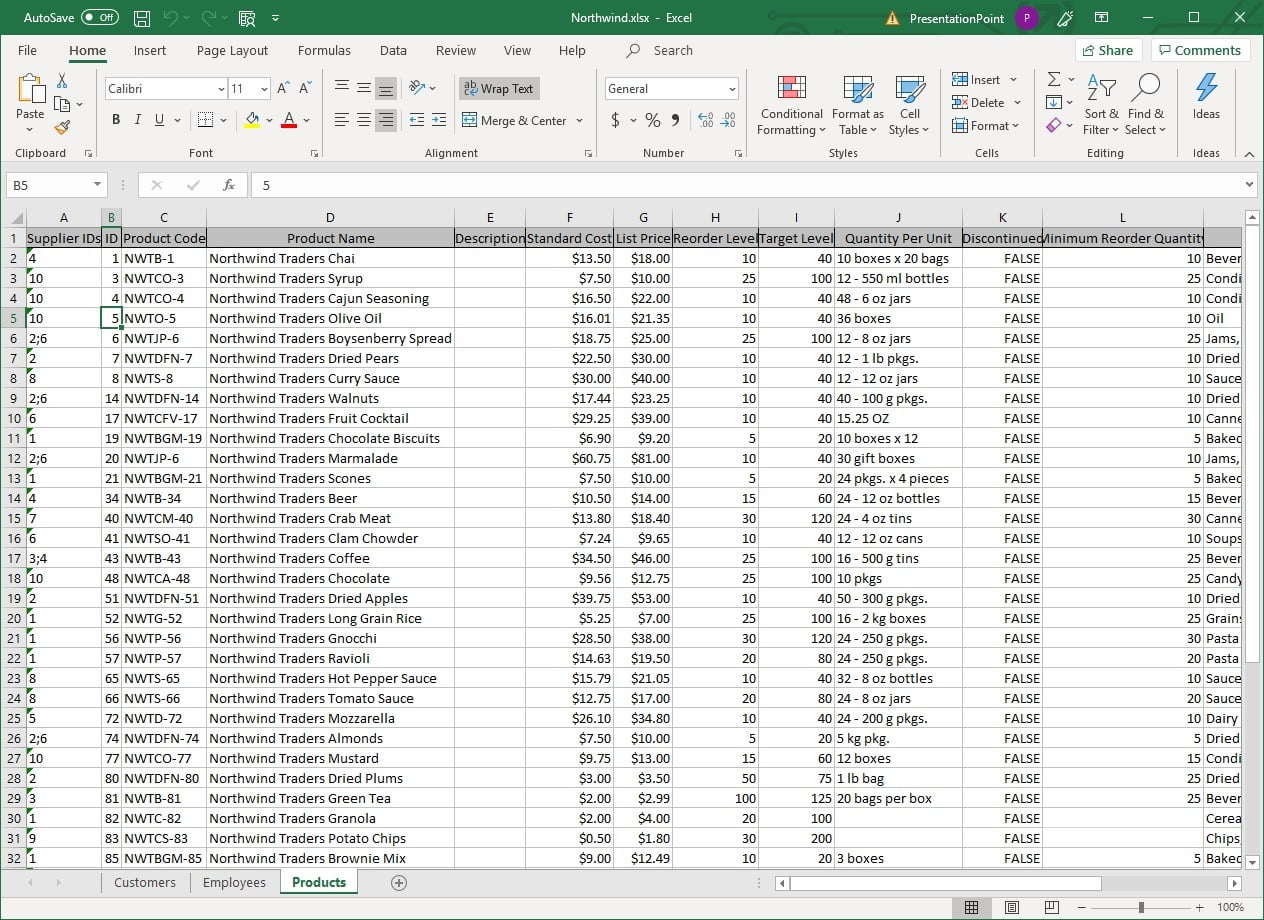
- A list of all the worksheets in your excel document will appear, select By Product worksheet
- Below change the range to A7: E1000.
A7- it is the first information on display. The end point of this range will need more explanations.
E- This refers to column E, that is the last data used on our worksheet. If we look at the Data E33 will appear as the last Data used. Since you cannot correctly know the total entry for a year. It is best to set the endpoint to E1000 to accommodate as much. DataPoint will automatically skip empty rows at the end of the data.
- On the option, you’ll notice the first rows contains field names. Simply set ‘Data refresh’ rate for continuous updating in an interval of 60 seconds. In every 60 seconds DataPoint will update from your worksheet.
- Then Rename the query to preview your Excel data here.
- Finally, click OK to close your connection.
How to Add Tables to your slide
- First insert a table to your slide, then use a table that has number rows and 5 columns. That table will show the names of customers and the remaining 4 columns is for the quarterly totals.
- Then select on the table and click on DataPoint table to open its dynamic properties.
- Here, you will find only one default data connection to your Excel file. First, copy the column names to the first rows of the table from your options. The Start filling Data automatically will set to 2.
- Then click OK to close. The data file automatically copies to the table.
- Then select all cells that have numeric data, and click on DataPoint and Table again.
How to format the Cells
Click and select the format tab. Then set the formatting to number. After which you increase the decimal places to 2, using 1000 separator for the cells. Then click OK to close.
How to prepare Slide Shows
- Make sure the presentation is set to loop forever since it will be displayed on a screen.
- Then click Set up Slide Show in Slide show menu.
- Verify that Show Type is set to Browsed at a kiosk.
- Then start your slide show by pressing F5 or simply click from Beginning on the slide show menu.
- You can now open the Excel document in another computer and edit content if needed.
- Finally, save your documents after corrections and DataPoint will automatically update new information’s every 60 seconds.
Conclusion
In conclusion, Use DataPoint to read the raw Excel data at every given point automatically. And then add professionalism to your result presentation by sharing your work with your audience using PowerPoint.


classic slide