

DataPoint
Combine data from multiple sources
Stream live data to your presentations and dashboards
Awesome product by the way. All this time and no one else can even come close to what you’re doing over there.
This tool saves us 100s of hours… This is a great tool and more companies should know about this.
Creating stunning data presentations has never been easier
DataPoint adds real-time data from over 25 source types allowing you to add data from thousands of data providers to your PowerPoint presentation including Excel, SQL, RSS feeds, news, weather, stock markets, and many others


Combine Data from Multiple Sources
Scrambling to find all your data? Automatically pull all your data together into one seamless report or presentation. After a one-time setup, you will never have to go looking for data again
Create Live Dashboards
Want a live sales dashboard? Or do you want to measure employee productivity, customer satisfaction, or other KPIs?
Show automatically updating data dashboards on any computer monitor or digital signage


Add QR Codes for Digital Signage
Automatically create QR codes so viewers can jump directly to sales pages, coupons, contests, polls, surveys, social media, websites, or other information on their smartphones to interact with you
Add Timers to PowerPoint & Digital Signage
Use functions like Clocks, Timers, Countdowns, and Count to add urgency and immediacy to your presentations and advertising.


Automate Data Updates, Distribute Offline
We know you have a lot of information out there, and it’s important that it’s always up-to-date. But we also know that updating can be a pain. That’s why we’ve made it easy for you to distribute the latest versions of your data offline as PowerPoint presentations, pdfs, printed charts, videos, and more!
Our Number One Product!
Our best-selling and most trusted product for over 18 years. Over 10,000 customers rely on DataPoint to curate, present, and dashboard their data.

Up-To-Date Data – Automatically
Stop waiting for updates to arrive. As soon as the source is updated, the presentation automatically shows the latest data
Stop Copying & Pasting Data
No more spending hours copying data and pasting it into your presentation. No data errors because data is shown directly from the source
Create / Curate / Present
Generate single slides, full presentations, pdfs, movies, and more all with the latest updated information. Perfect for meetings, presentations, and YouTube videos
How It Works
It is simple to make your data come to life using DataPoint
- Create a PowerPoint presentation
- Click the DataPoint tab
- Set up your connection to the data source
- Attach designs, like text boxes, images, tables, etc. to your data
- The data updates automatically when you open the presentation and when you run your slideshow
More Features
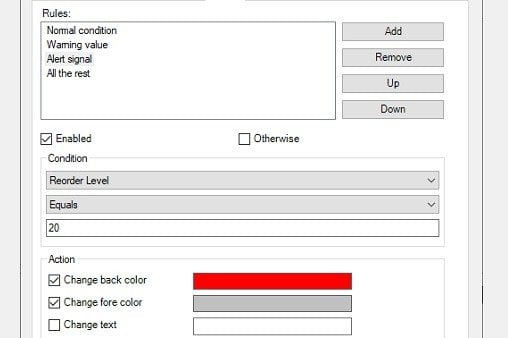
Set rules and conditions
For example, numbers 100+ can be displayed in different colors or with different backgrounds, etc. Or place a “SOLD” stamp over your real-estate property or sold out event.
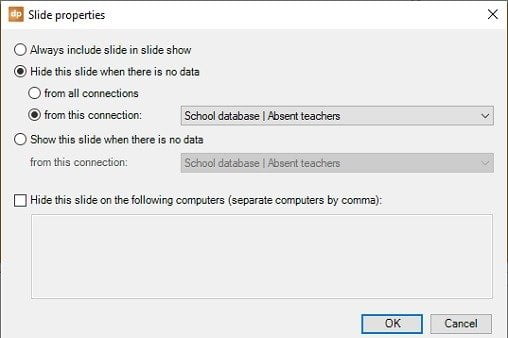
Show slide conditionally
Show or hide a slide based on the data. For example, the “Absent Teachers” slide won’t display if there’s no data on that day. Show the “Traffic Jams” slide only when you actually have traffic jams listed in the data.
Enterprise Edition:
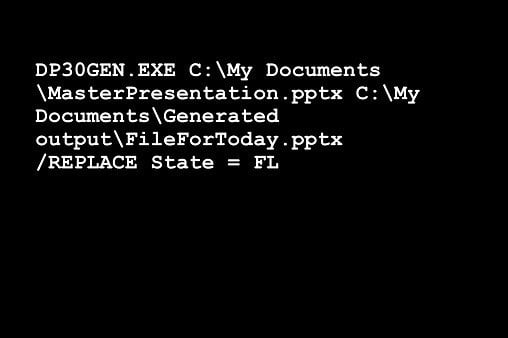
Command Line
Use the command line generator to generate snapshot presentations in batch or scripting.
Take a data snapshot every morning at 6 am. Or mail merge data into PowerPoint and generate presentations, pdf documents, or even MP4 movies in batch.
Enterprise Edition:
Viewer Edition
Share your data with colleagues and clients without having to worry about licensing each computer.
With DataPoint Enterprise Edition, you can distribute unlimited presentations to colleagues and clients so they can open using the free DataPoint viewer edition and see data displayed at any time without having a DataPoint license of their own. The slides will refresh upon opening, so they’ll always show the latest figures, which means no more updating slides by hand.


Industrial Edition: OPC
If you’re looking for a way to create live dashboards that monitor your manufacturing facility’s equipment and robots, look no further. Our OPC integration will allow you to combine data from multiple pieces of machinery and robots into a single monitoring dashboard, so you can visualize what’s happening at production in real-time.
You can also include graphs, temperatures, and other monitoring numbers to show what is happening with your processes—and if there are any numbers that indicate safety concerns or blocked processes, we’ll send instant notifications
DataPoint makes your data dynamic, visual, and up-to-date everywhere you need it – right through PowerPoint.
Over 10,000 Satisfied Users, Including:

What Do Clients Say About DataPoint?
“It was like finding an oasis in a desert. Not only does PresentationPoint do a fantastic job, but they seem to be the only ones providing this solution.”
– Derek Wood, VICTIG, USA
“Still DataPoint crushes the competition for ease of use and deployability. We use Intel Compute Sticks connected to 55 inch screens in different modes and flavors… It’s AMAZING to see how creative we can get when creating new Digital Signage… and the DYNAMIC ability to do so much… Impresses all who see it… Funniest thing I hear from IT Pros… WAIT what?? That’s PowerPoint??” HOW??? I just laugh. Keep up the great work!”
– Chris Carson, HD Supply, USA
“Awesome product by the way. All this time and no one else can even come close to what you’re doing over there.”
– Jason Brentlinger, Production Manager, Bartha, USA
“At Booking.com we recently used DataPoint to merge existing reporting data to create and distribute personalized reporting to +1100 of our managers.”
– Savka Gajic, L&T Program Manager, Booking.com, The Netherlands

