
In this article, we are going to discuss how to create mail merge PowerPoints and what to use them for.
PowerPoint is a perfect tool for mail-merging reports. What am I saying? PowerPoint is the best and cheapest way to do your mail-merged individual reports, but only in combination with our DataPoint add-on. This plugin allows you to connect your PowerPoint shapes like text boxes, charts, images and tables directly to your data sources. The advantage? Always up-to-date presentations and in real-time. No waiting anymore for colleagues copy-pasting the information from your Excel to PowerPoint. No typos anymore. Once that the presentation is linked to your data, you just open your presentation and it is up-to-date.
In this article, I will explain how you can link your presentation to your data very quickly. And then I’m going to show you 4 ways to generate your mail-merged up-to-date presentations and documents.
1. The Initial Data Linking
I’m going over this very quickly. The nature of our DataPoint add-on is to connect to some 25 data providers to get your data. After setting up the data connections, you start to link it to text boxes, charts, tables etc. Here is a nice introductory on how to connect and display Excel information. And don’t forget to activate the mail merging settings, which is called data scrolling in our product. This will generate multiple slides or pages because DataPoint offers you the flexibility to design e.g. one slide only and then mail merge this in a larger presentation or report. One per item that you are reporting on.
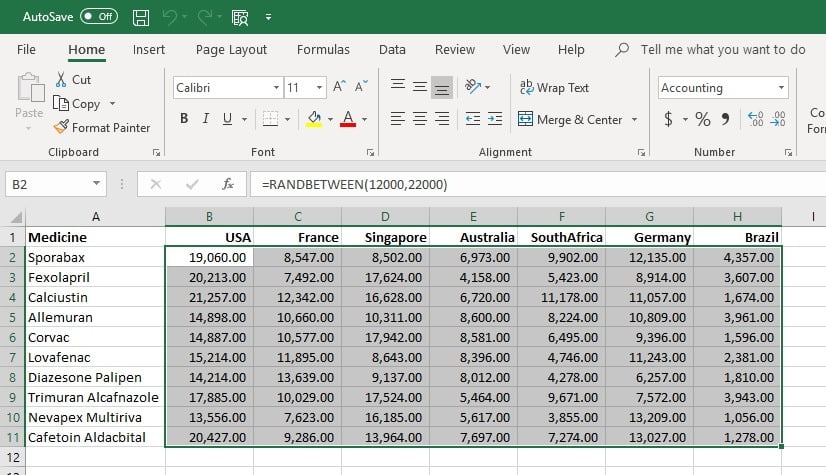
Have a look at our demo files here. On one side we have an Excel file with fictive medicines and sales figures per country where we are selling these medicines of us.
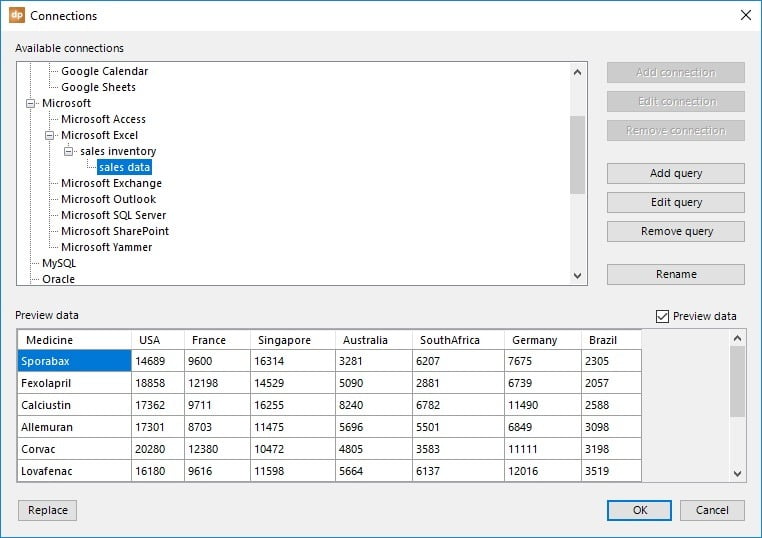
Here you will see a preview of your Excel data (or any other data) in PowerPoint with our DataPoint.
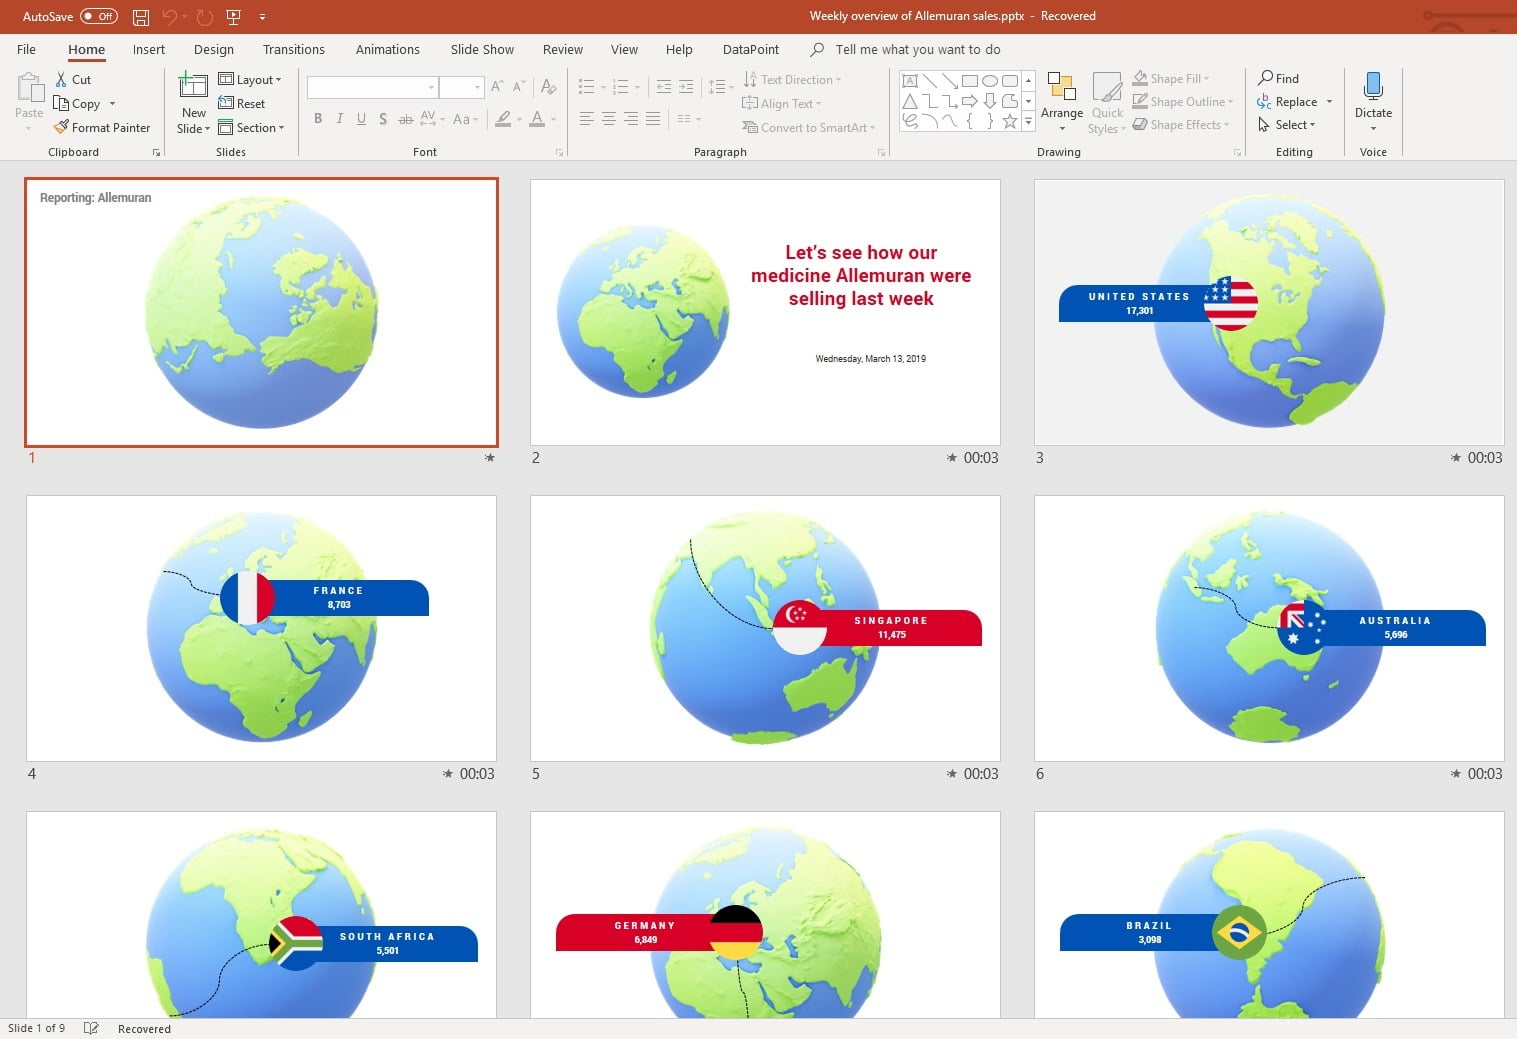
And secondly, we have our nice PowerPoint presentation where we want to visualize these sales figures on an animated 3D planet. We will dynamically link the text boxes of PowerPoint directly to the corresponding data cell of our data source.
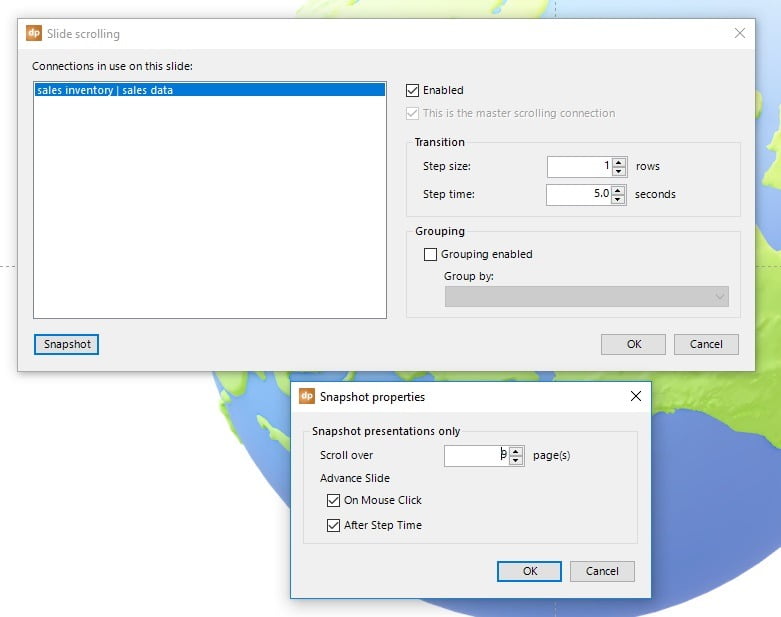
And our data scrolling options are set to a step size of 1 row (advance one row at a time when scrolling) and it will scroll over all 9 pages to keep everything together.
We will walk thru the 4 options that we have to use mail merge PowerPoint functions to generate up-to-date documents and presentations.
2. As One Big Presentation or Report
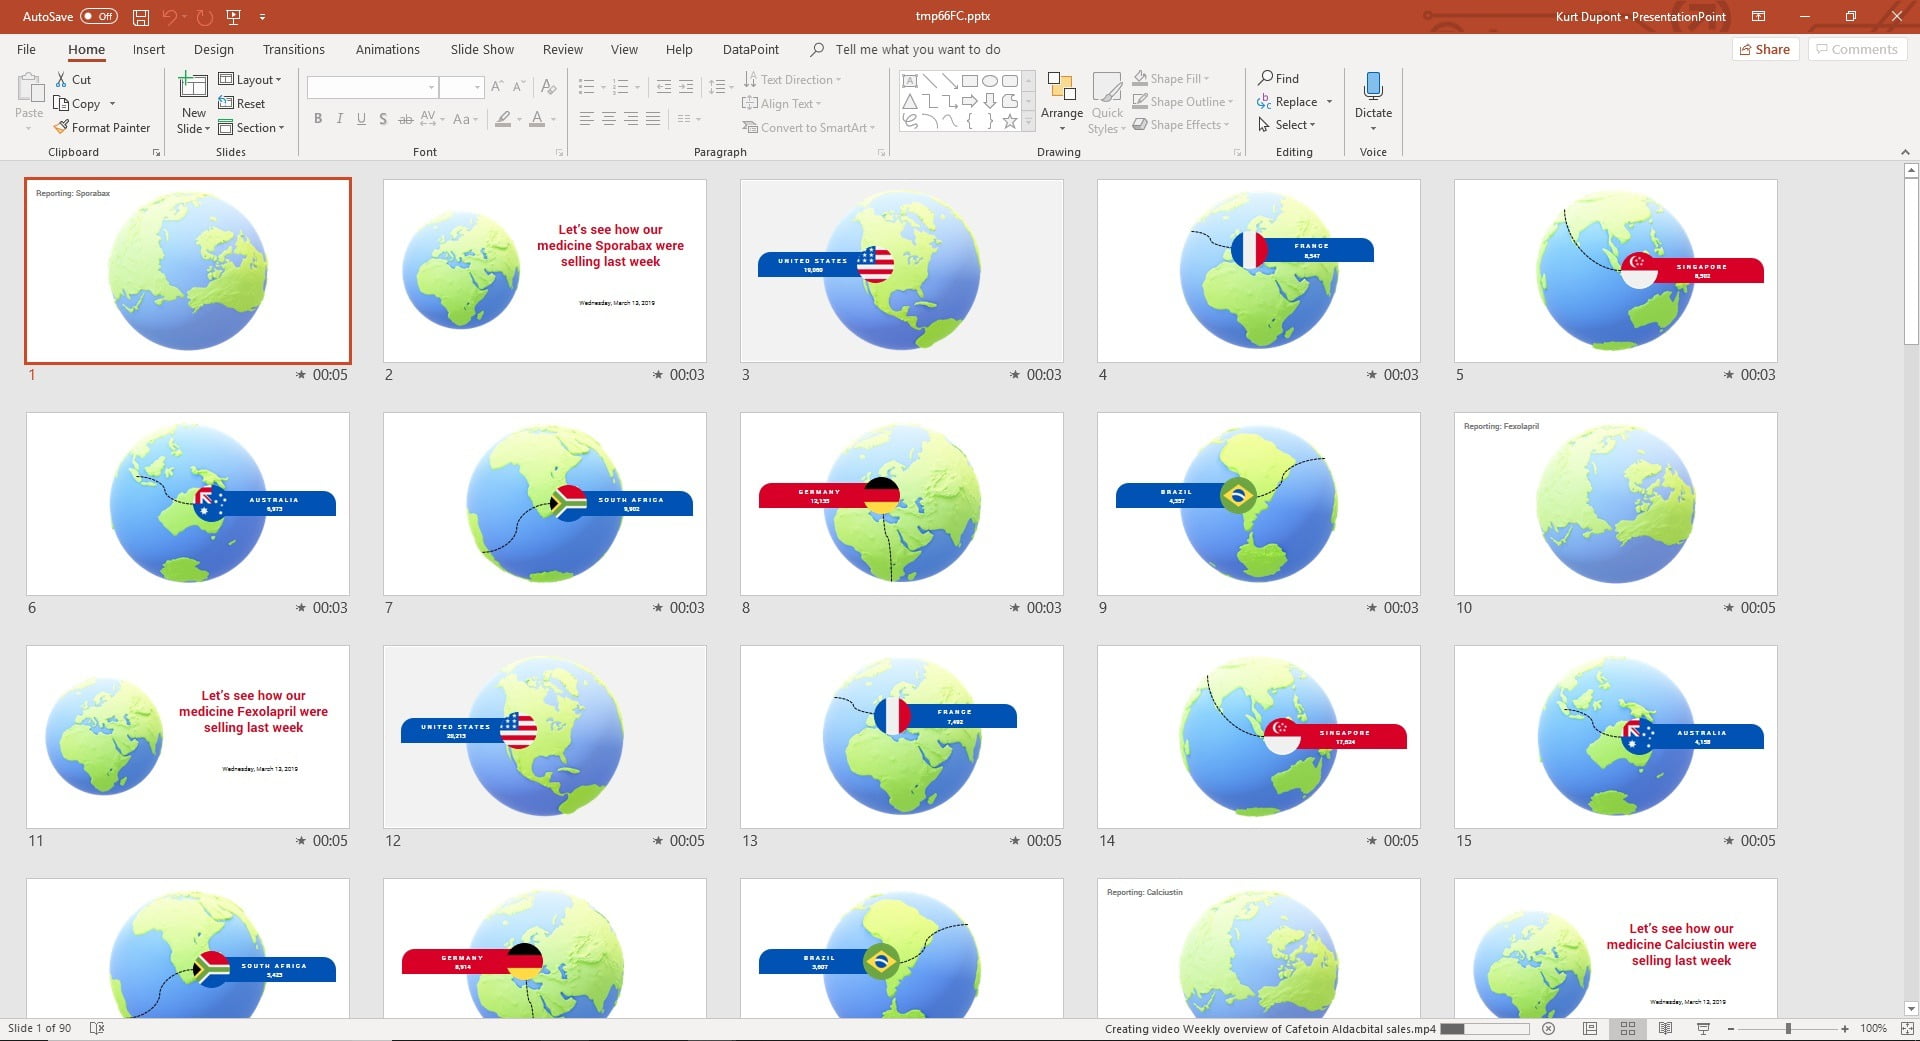
Click the DataPoint’s Snapshot button. This action will create a new mail merge PowerPoint presentation with the latest data from your data sources, and then generate a new large report or presentation with all mail merged slides. Our data file contains 10 fictive medicine names and sales figures. Our base presentation counts 9 slides to visualize all the data of one medicine.
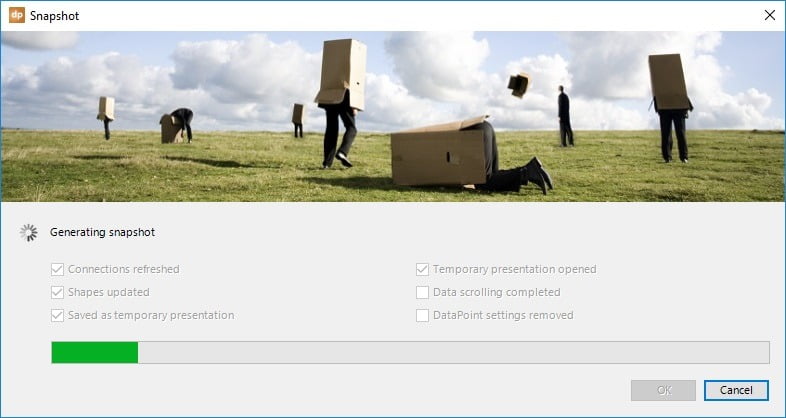
So the outcome of this snapshot generation process is a new up-to-date presentation of exactly 90 slides. 9 slides per medicine. 10 medicines in total. This snapshot presentation is generated in some 10 seconds time, and can be forwarded and distributed to others; colleagues, resellers, distributors, …
3. As Individual Mail Merge PowerPoint Reports
The Enterprise edition of DataPoint allows us to generate multiple documents or presentations instead of one large file. Click the Snapshot Save As button. Here you can choose the column from your data source that will be used to give the document a name. So you can save your reporting on medicine XYZ as XYZ.pptx. Or add more information before and after the medicine name like e.g. Weekly overview of XYZ sales.pptx.
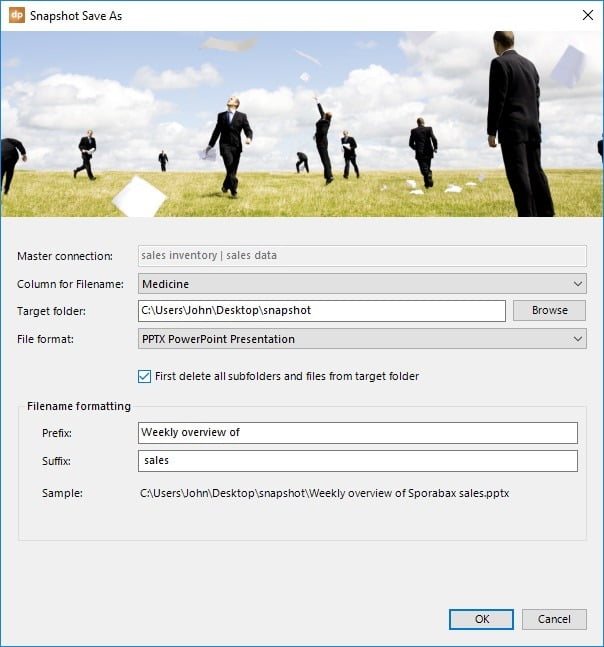
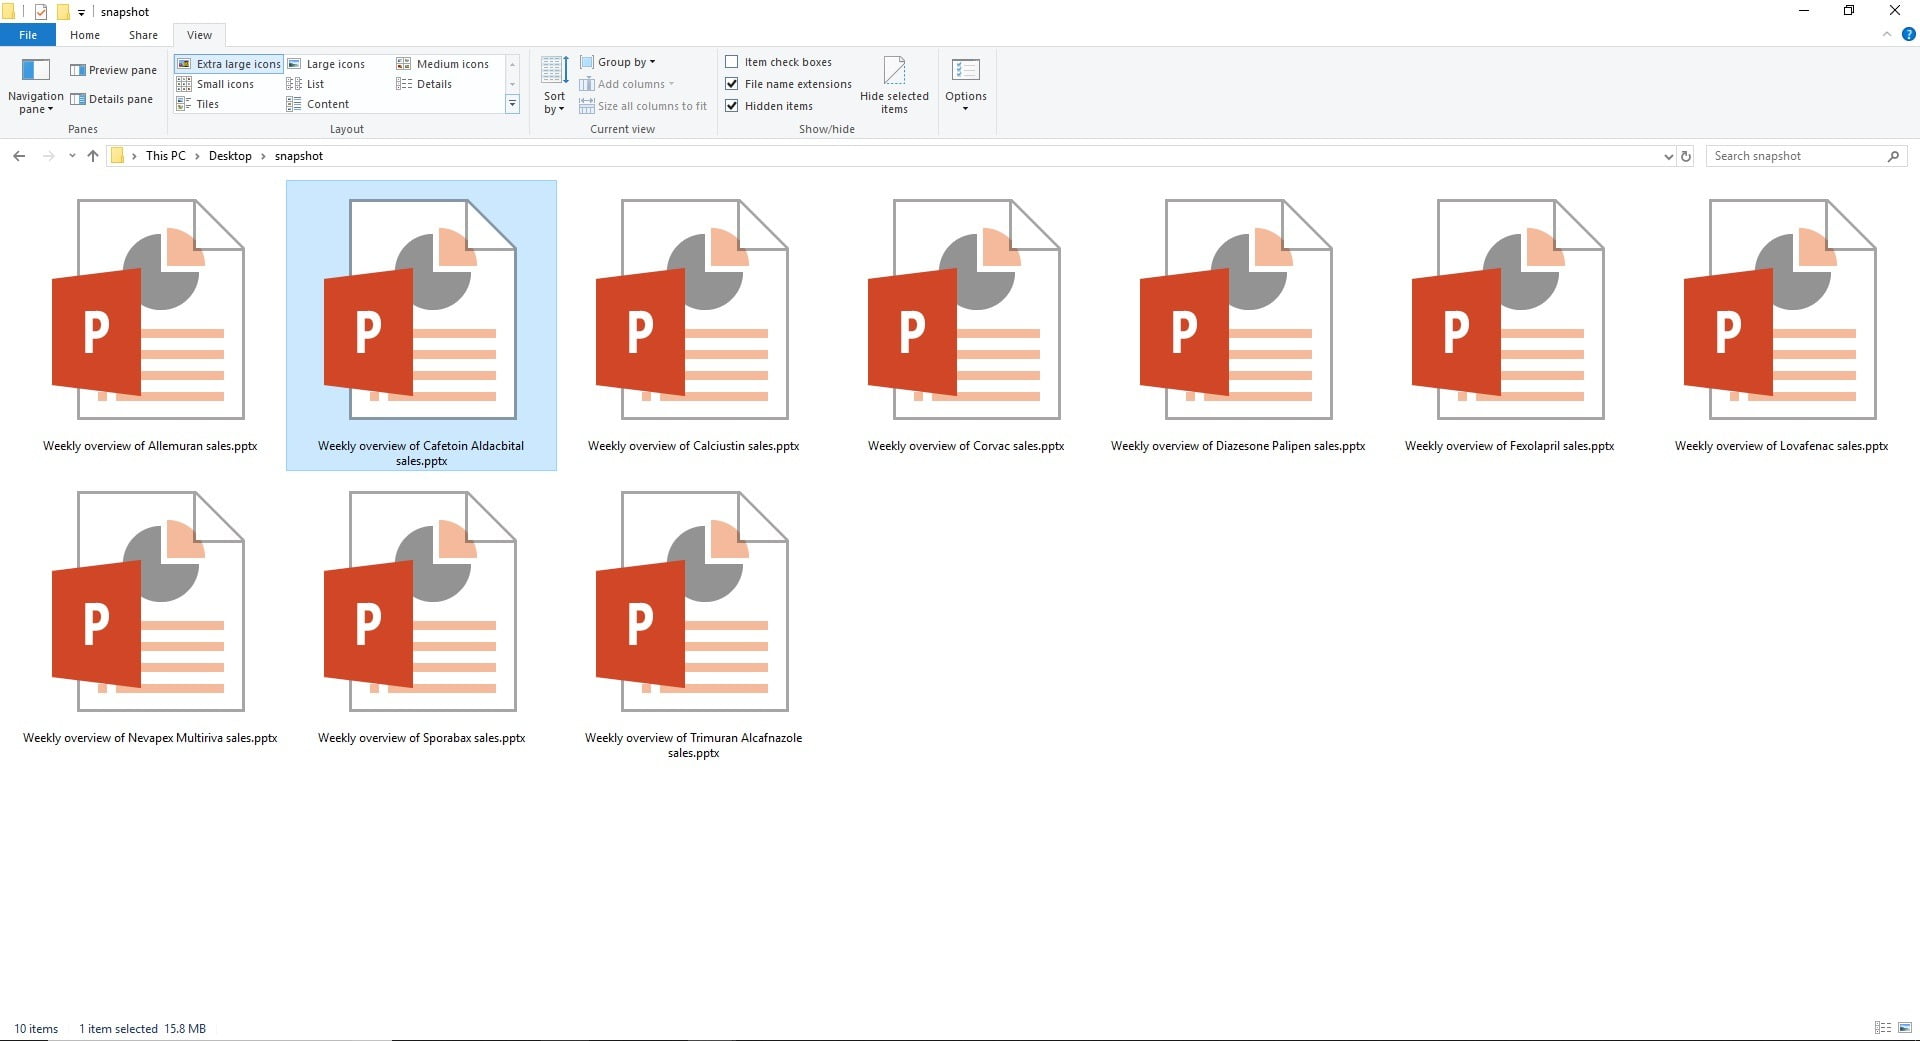
This process takes almost the same amount of time than the generation of our one large presentation. Here for this sample, give the process some 10 seconds to complete. In the end, you will have a folder with one presentation per medicine. So 10 presentations with 9 slide each, with personalized content.
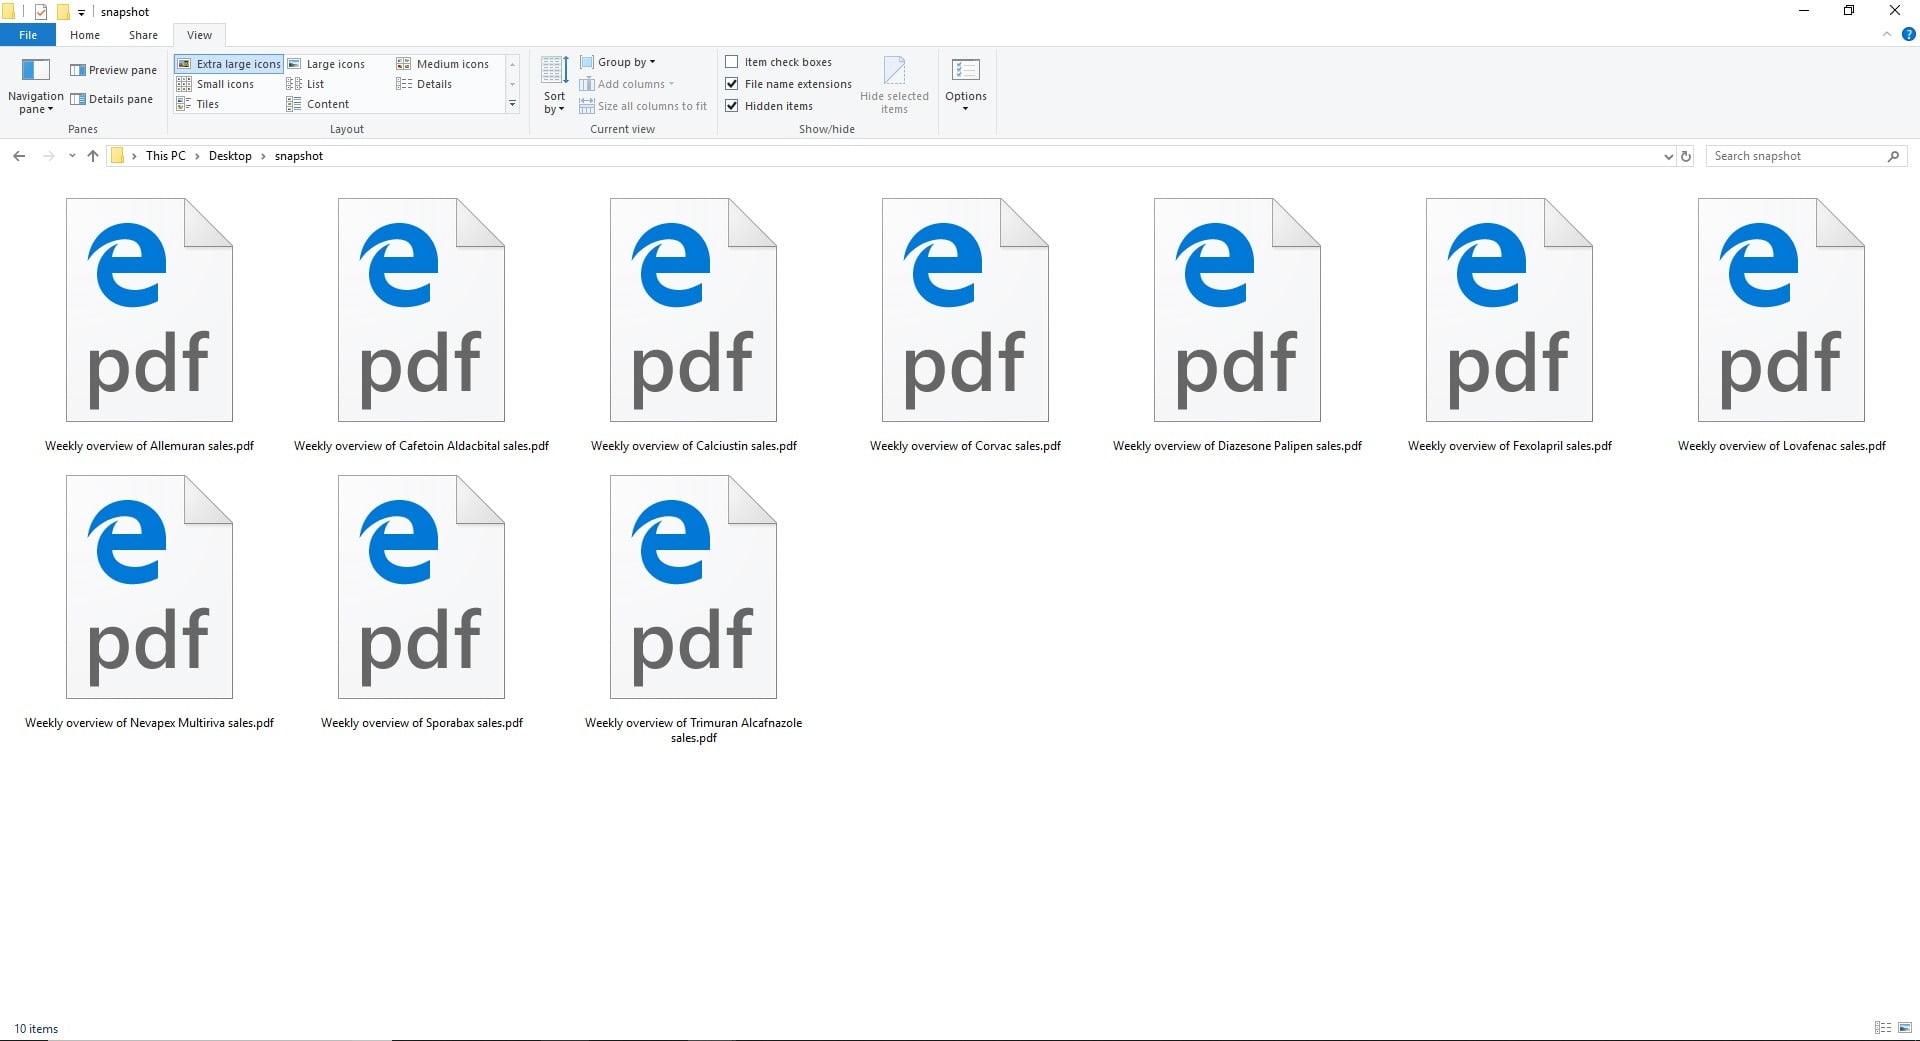
4. As Individual PDF Documents
PowerPoint is great because it is easy to edit and it has great animations to emphasize your message. Sometimes people want to have PDF documents because they don’t need a PowerPoint to view it and the file size is smaller because the animation and moving parts are taken out. If that’s what you need, generate individual up-to-date PDF reports, then look at this option.
Click the Snapshot Save As button again and look at the File format combo box. Set it to PDF Document and click the OK button. This generation process will take some longer because it will be converted to PDF and that takes extra time.
In the end, your output folder is filled with 10 up-to-date PDF documents. 1 PDF document per medicine with its specific data.
5. As Personalized Movies
Nothing fancier than a customized personalized video for reporting. Video is everything and everything is going to be a video. Think about Facebook posts with video content; much more attractive because people are lazy and want to be entertained. Can you entertain your colleagues with video data reporting? Read on.
Use the Snapshot Save As again and set the File format to MP4 video and hit OK to start the report generation process. After the process, the folder will contain 10 individual MP4 video files that could be distributed or uploaded to Youtube.
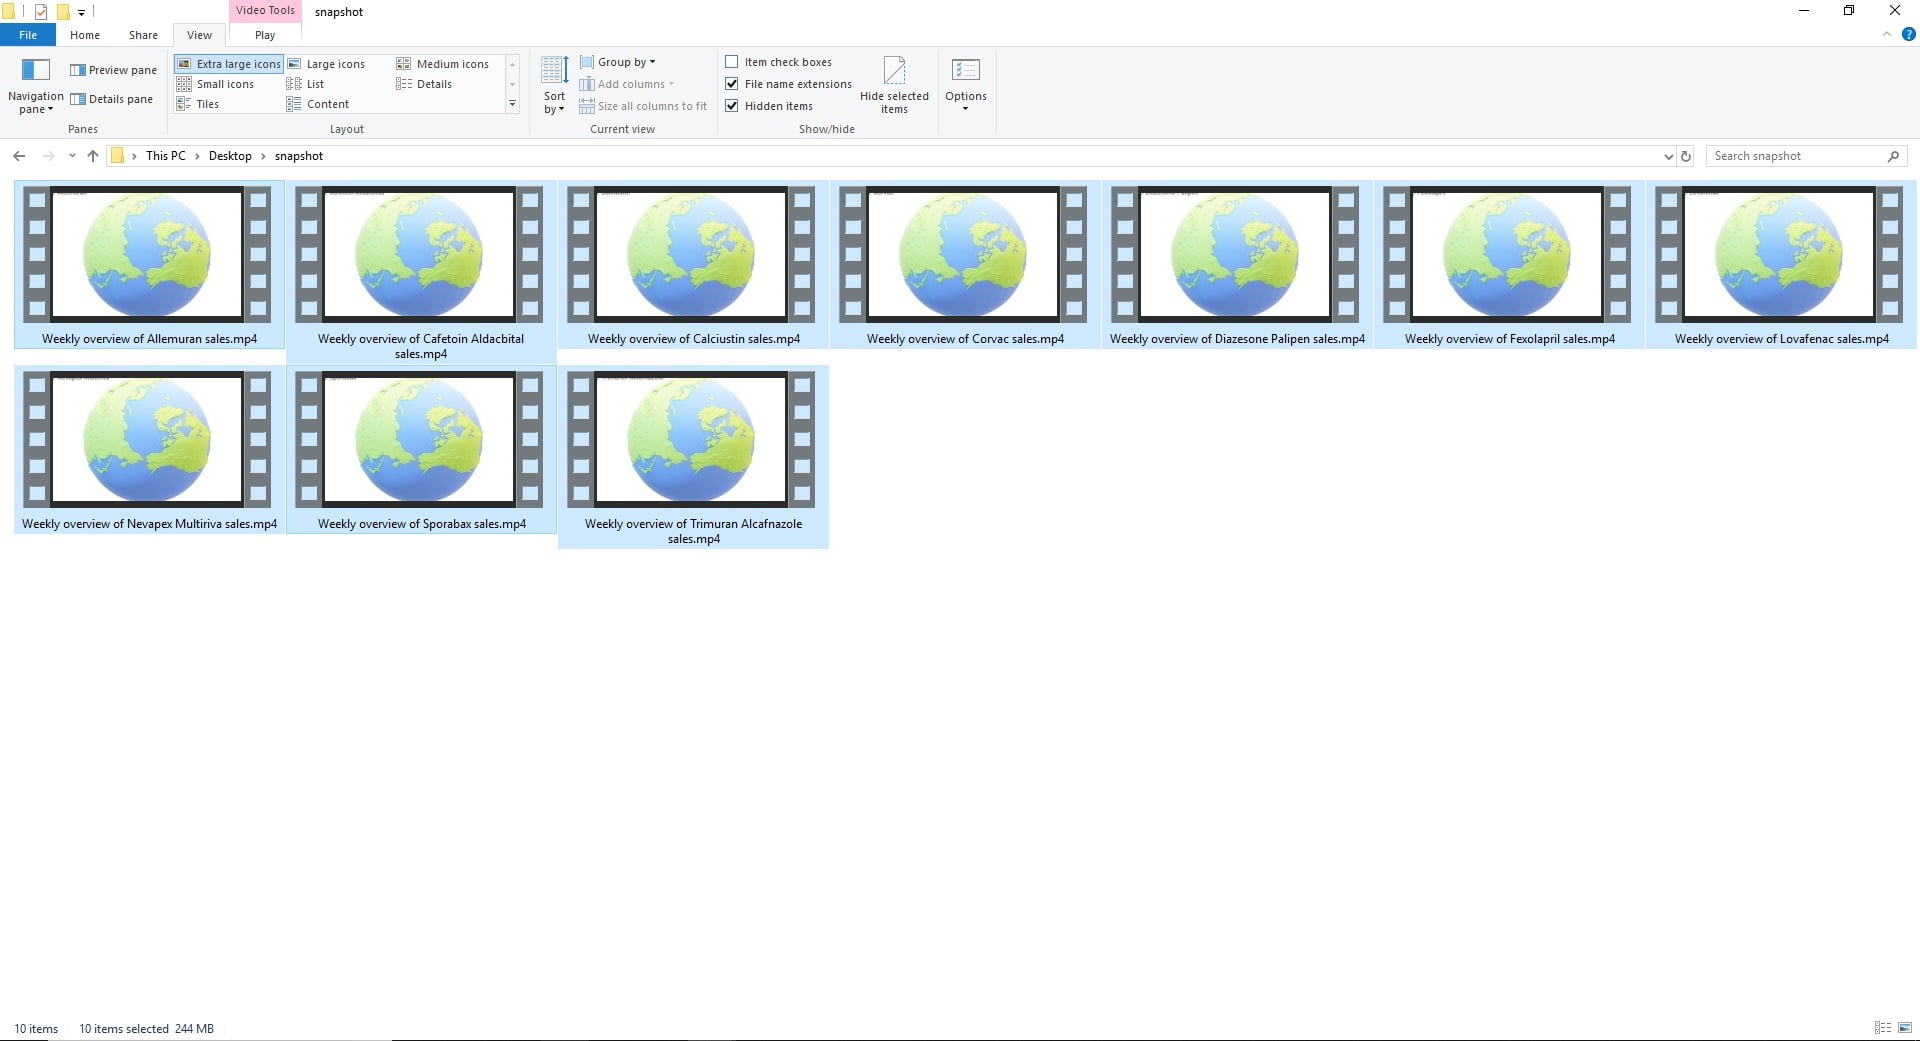
See here how one video looks like. The others look alike but is always for another medicine with its own sales figures.
The advantages of mail merge PowerPoint videos are super:
- No PowerPoint needed to play the file
- Content cannot be altered
- Professional look
- All designed and generated in PowerPoint
- Attractive for playback and sharing
Get your free trial of DataPoint.
And here are links to our generated sample videos with custom data.


