
When you work in a warehouse, bank, logistic company, plant, factory, or many others, you most probably work with dashboards. Have you ever met an ugly dashboard? Have you met an information panel that did not inform you, but confused you with the information that it tried to convey to you? Or did you see the panel that attracted you with the appearance and how informative it was? You probably have thought about what can make an information panel effective or vice versa.
In this article, we will discuss some key ideas on how to make the dashboard design attractive and informative. But first, let’s see what is the dashboard.
What is dashboard
This is a visual display filled with the most important information designed to achieve one or more goals; this information can be collected and located on a single screen, so it can be processed immediately.
Let’s divide the definition into several keywords and expressions:
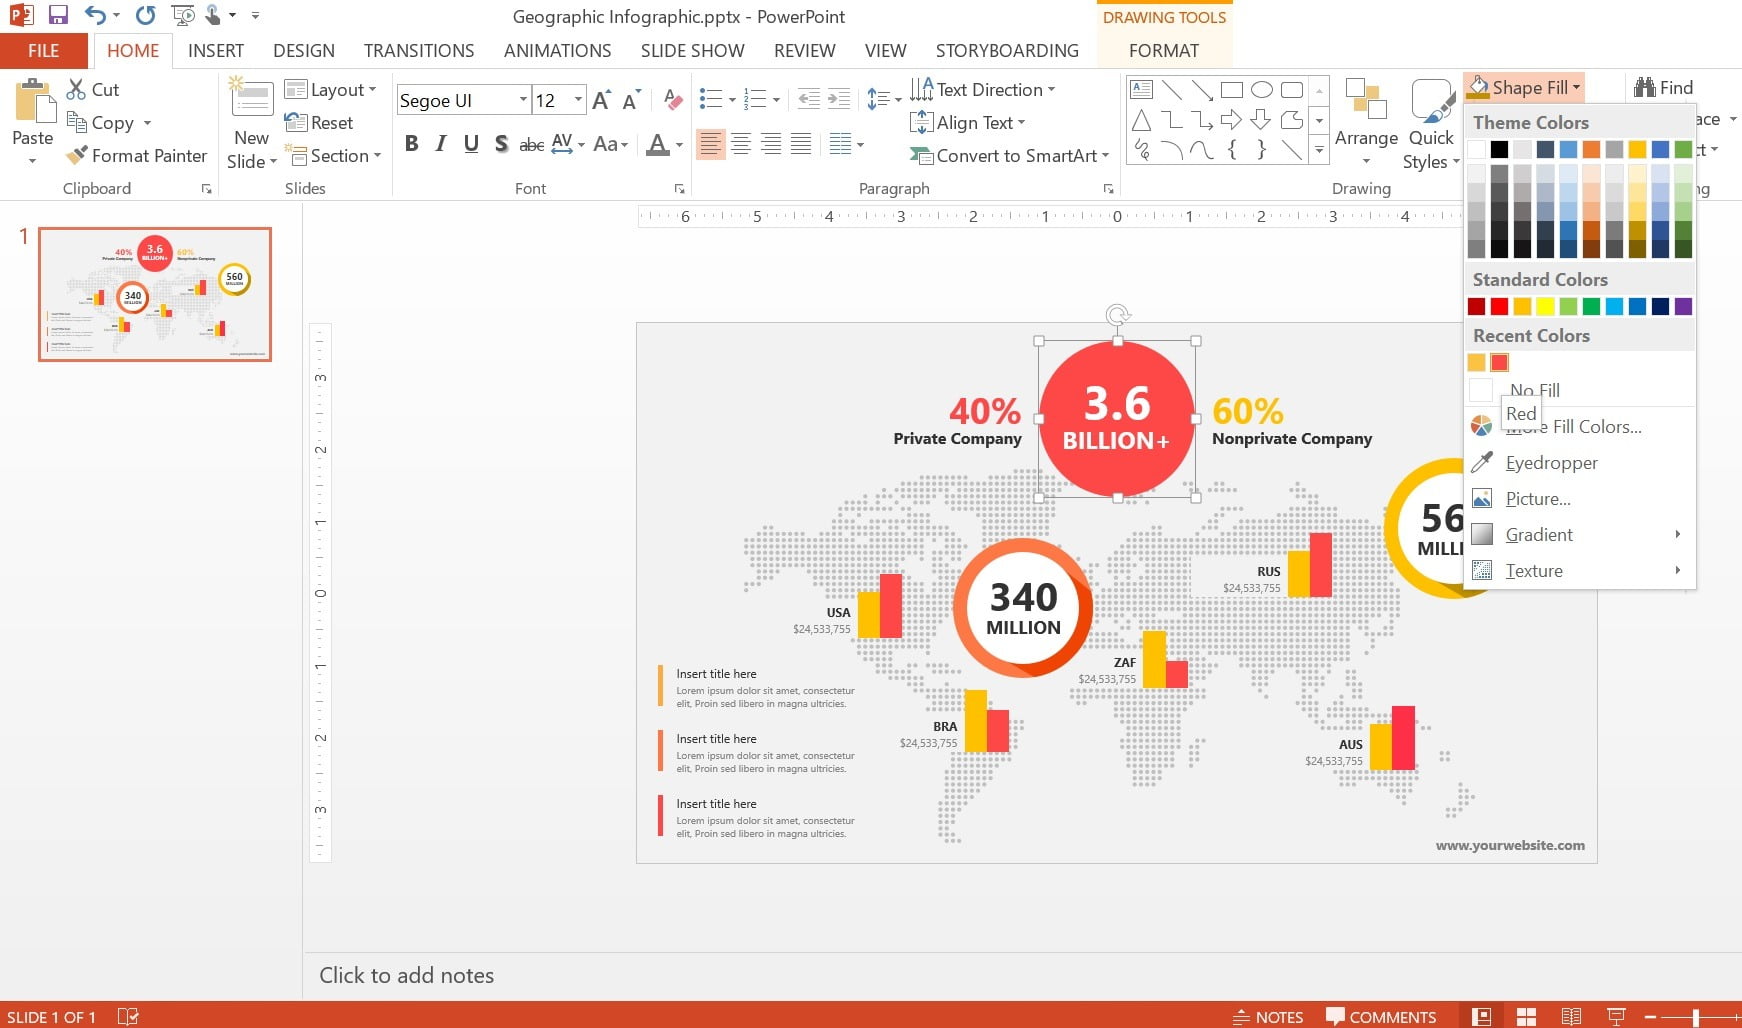
- A visual display does not mean that all panels must have diagrams and charts. A dashboard can be effective by having text content only. However, all information panels are viewed by people, and when creating them, it is important to have an understanding of human visual perception.
- The most important information — all dashboards should contain information that is useful for worker or client.
- Goals — each dashboard should inform the user or initiate a transition to another application.
- A single screen — ideally the provided information should fit the single screen.
- Immediately — the information panel should not force the viewer to make a lot of efforts to understand what he needs. It must present information explicitly and invite the viewer to learn more if the information interests him.
Dashboards for different departments
Because dashboards contain the most important information, you need to determine what is the most important information for each department in the company. We collected a list of such information:
- Production department — produced product units, product type units, price per unit, ordered products.
- Sales department — leading products, contracts, average contract value, average transaction time, employee sales, sales by region, total sales of the product.
- Marketing department — visiting, downloading, leading products, the price of each product, consumer costs, profit.
- Support department — total number of tickets, open tickets, average turnaround time (TAT), customer satisfaction, ticket components solved within the SLA, ticket components closed for each person, % of issues resolved.
- Personnel department — the coefficient of firings, the number of unsuccessful interviews, the average time to hire a new employee, open vacancies, dissatisfaction with payments.
These data will help highlight the most important working data for each department. However, before you start building any information panel, you need to spend time understanding what is important to your customer, what information will be important for him.
Key principles to create great dashboard design
1. The rule of 5 seconds
The dashboard you are designing should give the necessary information in not more than 5 seconds. Ideally, it should contain the most relevant and the most demanding data. If it takes longer to find the necessary information, the dashboard is not designed properly.
2. Is the inverted pyramid of a logical layout
The most important information must be located in the top, trending one in the middle and the smallest details in the bottom.
3. Minimalism
Do not try to add a lot of visualizations to the dashboard. Are there scientists say that people can catch about 7 ± 2 elements at the same time. It means that you should avoid adding more than 9 elements to the dashboard.
4. Choosing the right data visualization
Add the relevant visualization type. It might include relationship, comparison, composition, and distribution.
Why DataPoint is the best for dashboard design
 DataPoint is the technologically enhanced presentation software. It connects your TV screens, presentations, notice boards, and other items to real-time data sources. DataPoint is a powerful PowerPoint add-on, which can link your presentation slides to different data sources.
Basically, PowerPoint is the best tool to design your dashboards. You can easily add the necessary visual information and, using the DataPoint, you will be able to connect the external resources to display the live data on the screen and share all the changes immediately.
If the process is completely automated and you do not even click a mouse to change or update the data. The slideshow can be added to information kiosk presentation for looping.
Another great benefit is that you do not need deep knowledge to create a presentation. Do you know how to use PowerPoint? Then you know how to use DataPoint.
What will you need to create a real-time presentation and displayed on the dashboard screen? It’s very simple:
- Create the presentation.
- Add the image as the background.
- Connect the external resource to broadcast a live data.
After that, you will benefit your dashboard, and the employees and clients will use the most relevant and updated information.

