I guess that not many people use and know the slide master option of PowerPoint. The slide master is the starting position of your slide where you can control the zones on your slides, default shapes, colors, backgrounds, fonts, etc. Basically what you put on your slide master, is visible on all slides that are based on this slide master.
So with our DataPoint plugin, you can show dynamic content in shapes on your slides and show real-time data. But sometimes people want to show dynamic data on all slides. Think about the clock at the upper right corner of every slide of an information screen. When you want to change the font or color, then without the slide master, you would have to do that on every slide. No! Save time and put that clock one time on your slide master, and everything is copied to the slides automatically.
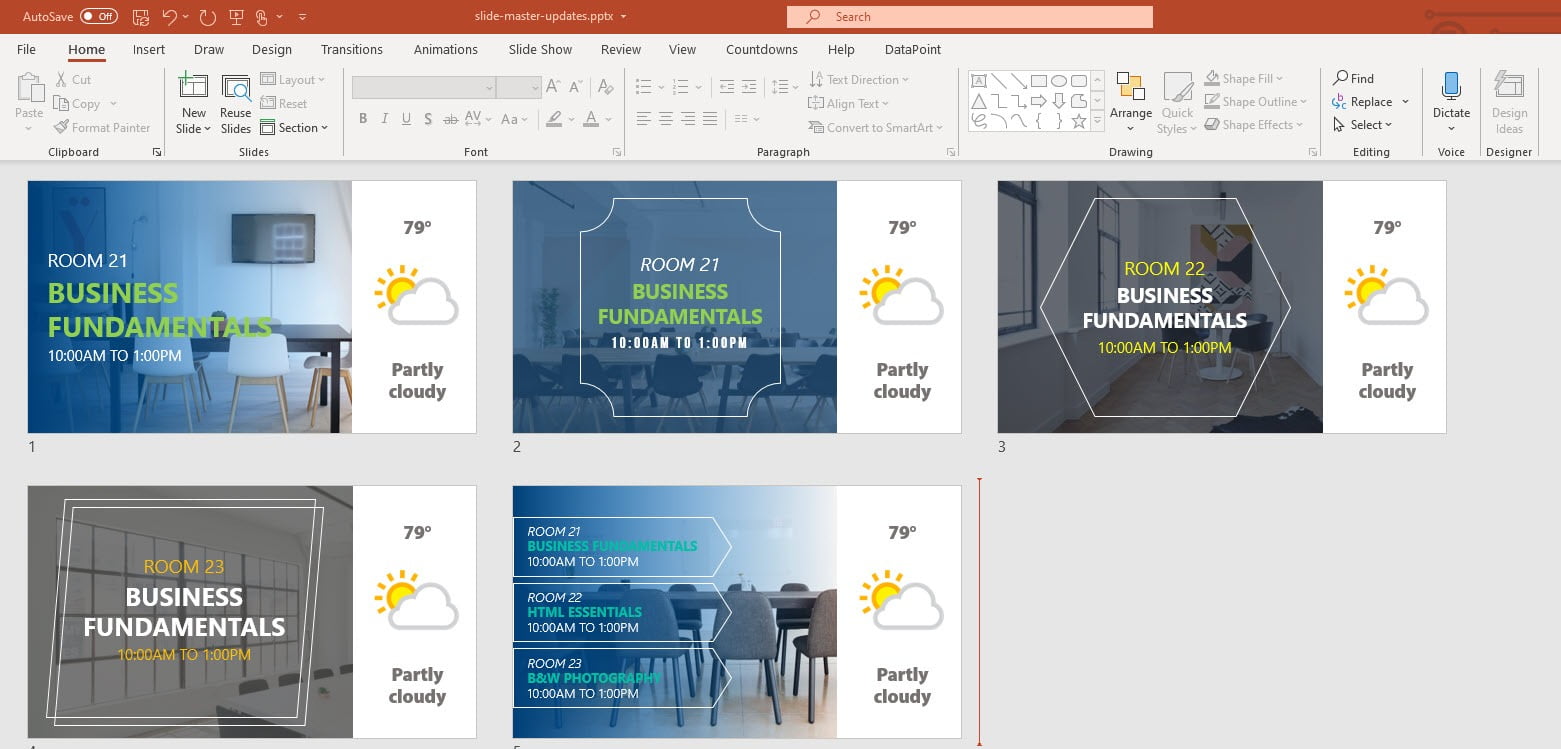
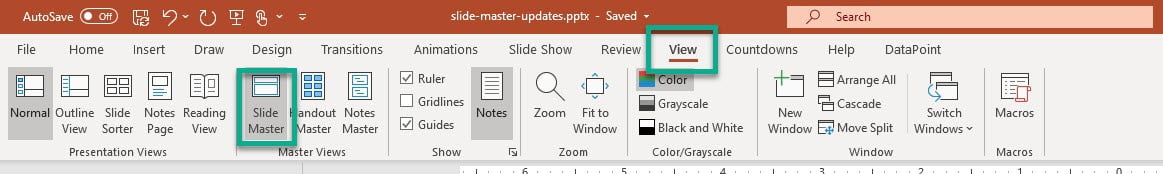
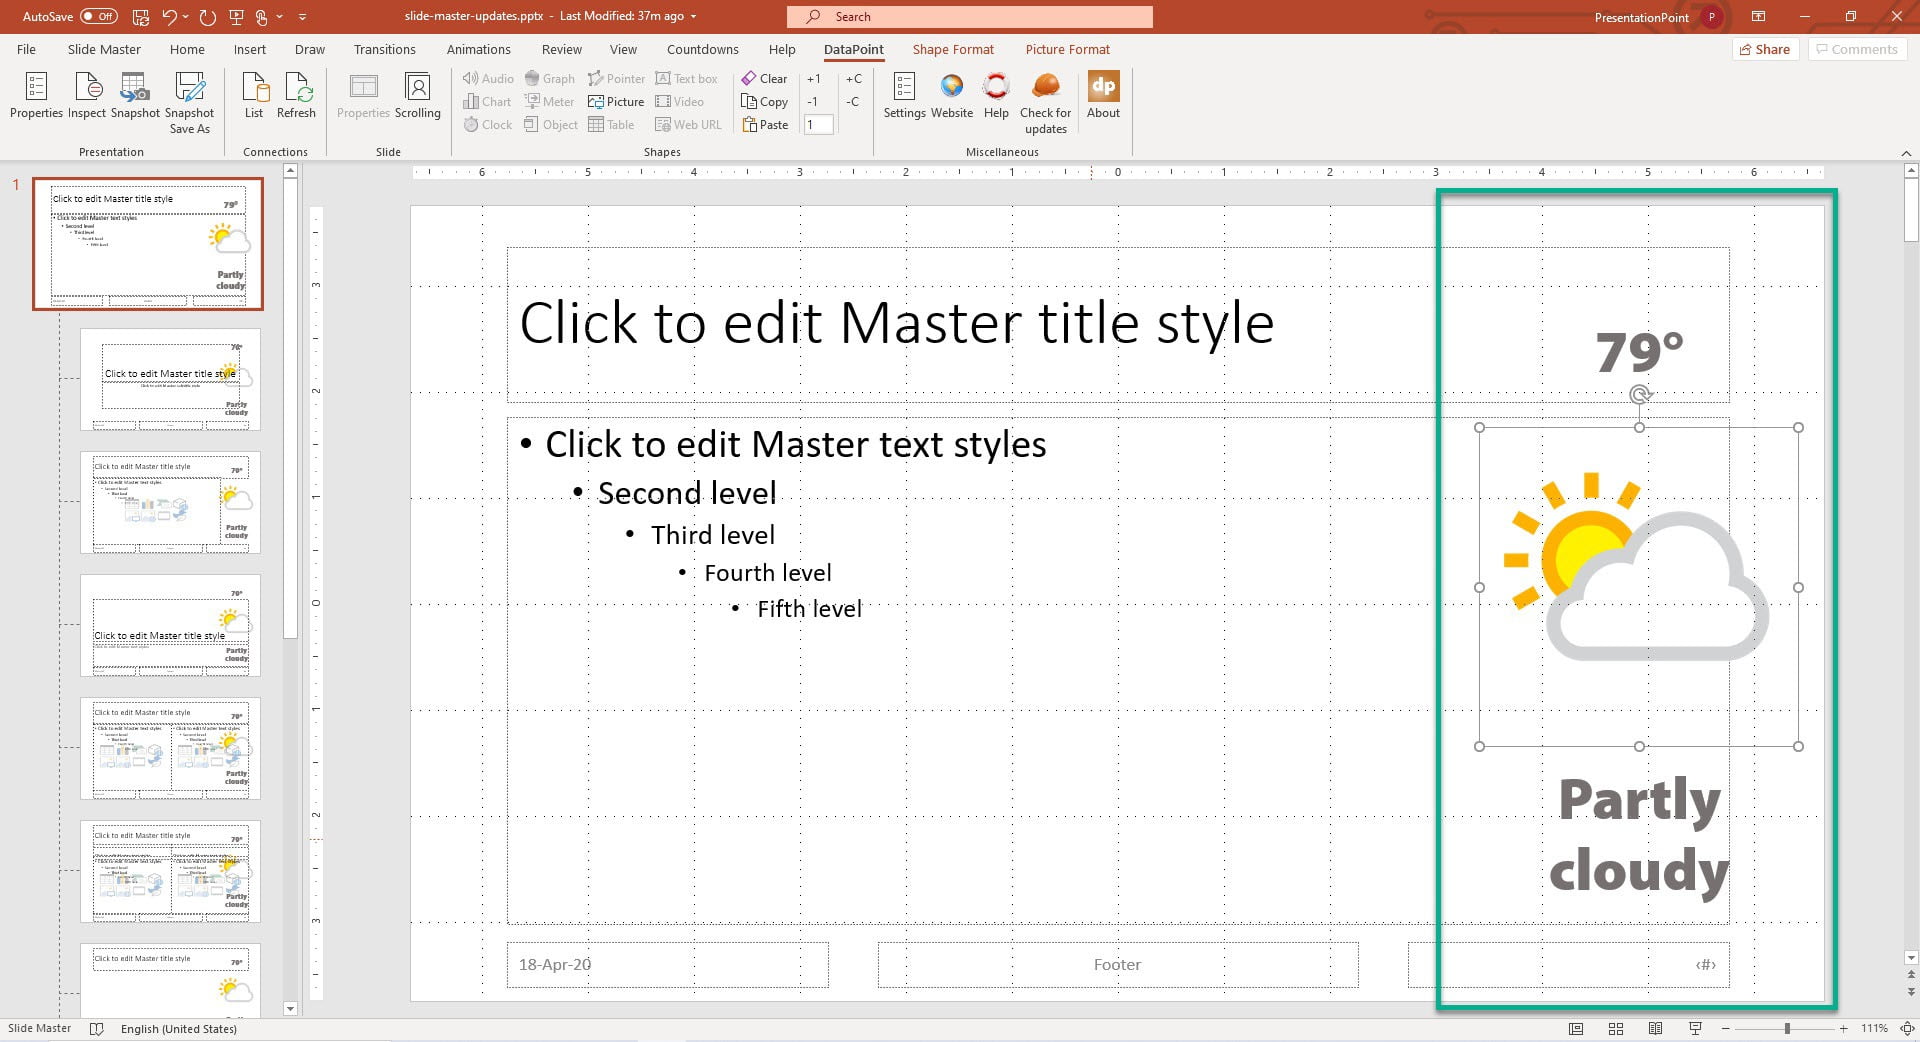
Let’s give an example where we have a digital signage or information screen in our office. We are showing room reservations or classroom info on multiple slides. Now we want to add weather information to the slides. To start using the slide master, click the View option, and then Slide Master from the PowerPoint ribbon.
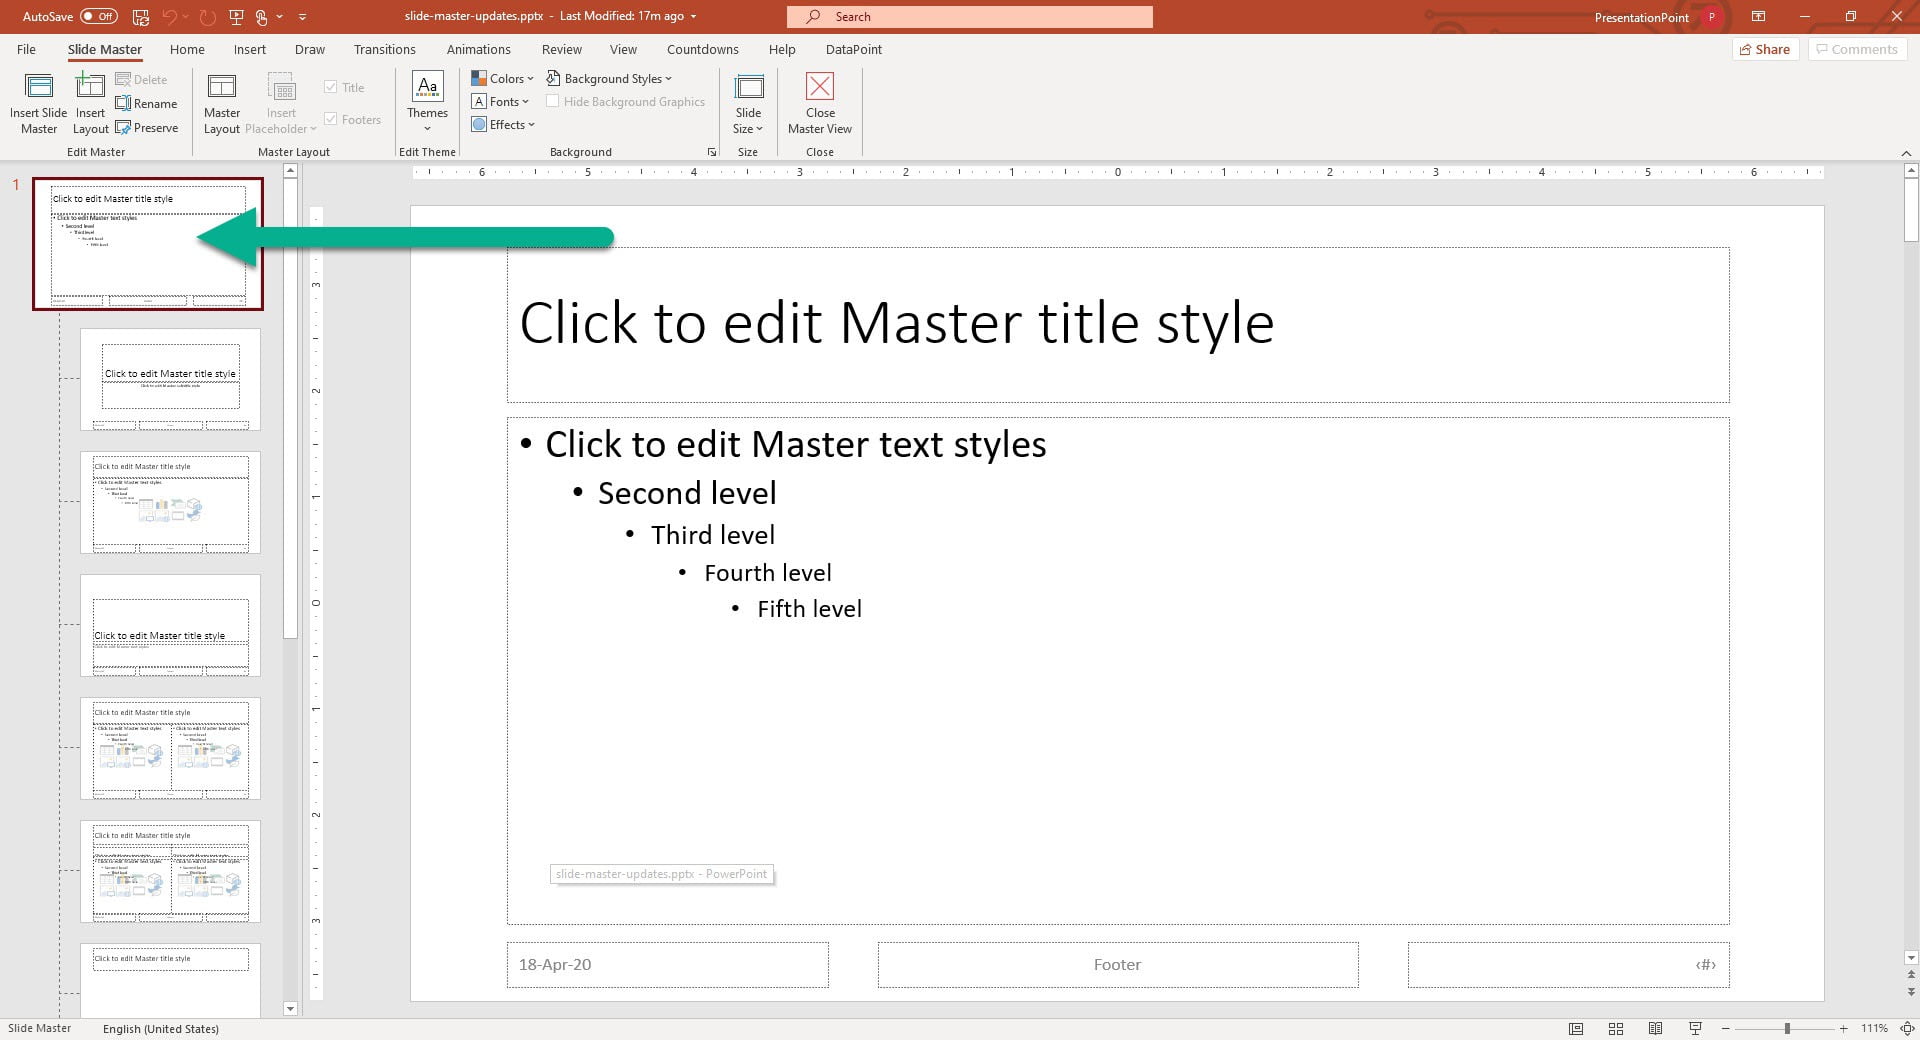
At the left here, you see some slide master slides. At the top, you have a slide master, and beneath that, you will find several layouts for different purposes. A layout with a title and subtitle, a layout with a table, a layout with text and image, etc.
We don’t need those layouts. For this purpose, we need to select the ‘top slide’ here, called the slide master itself.
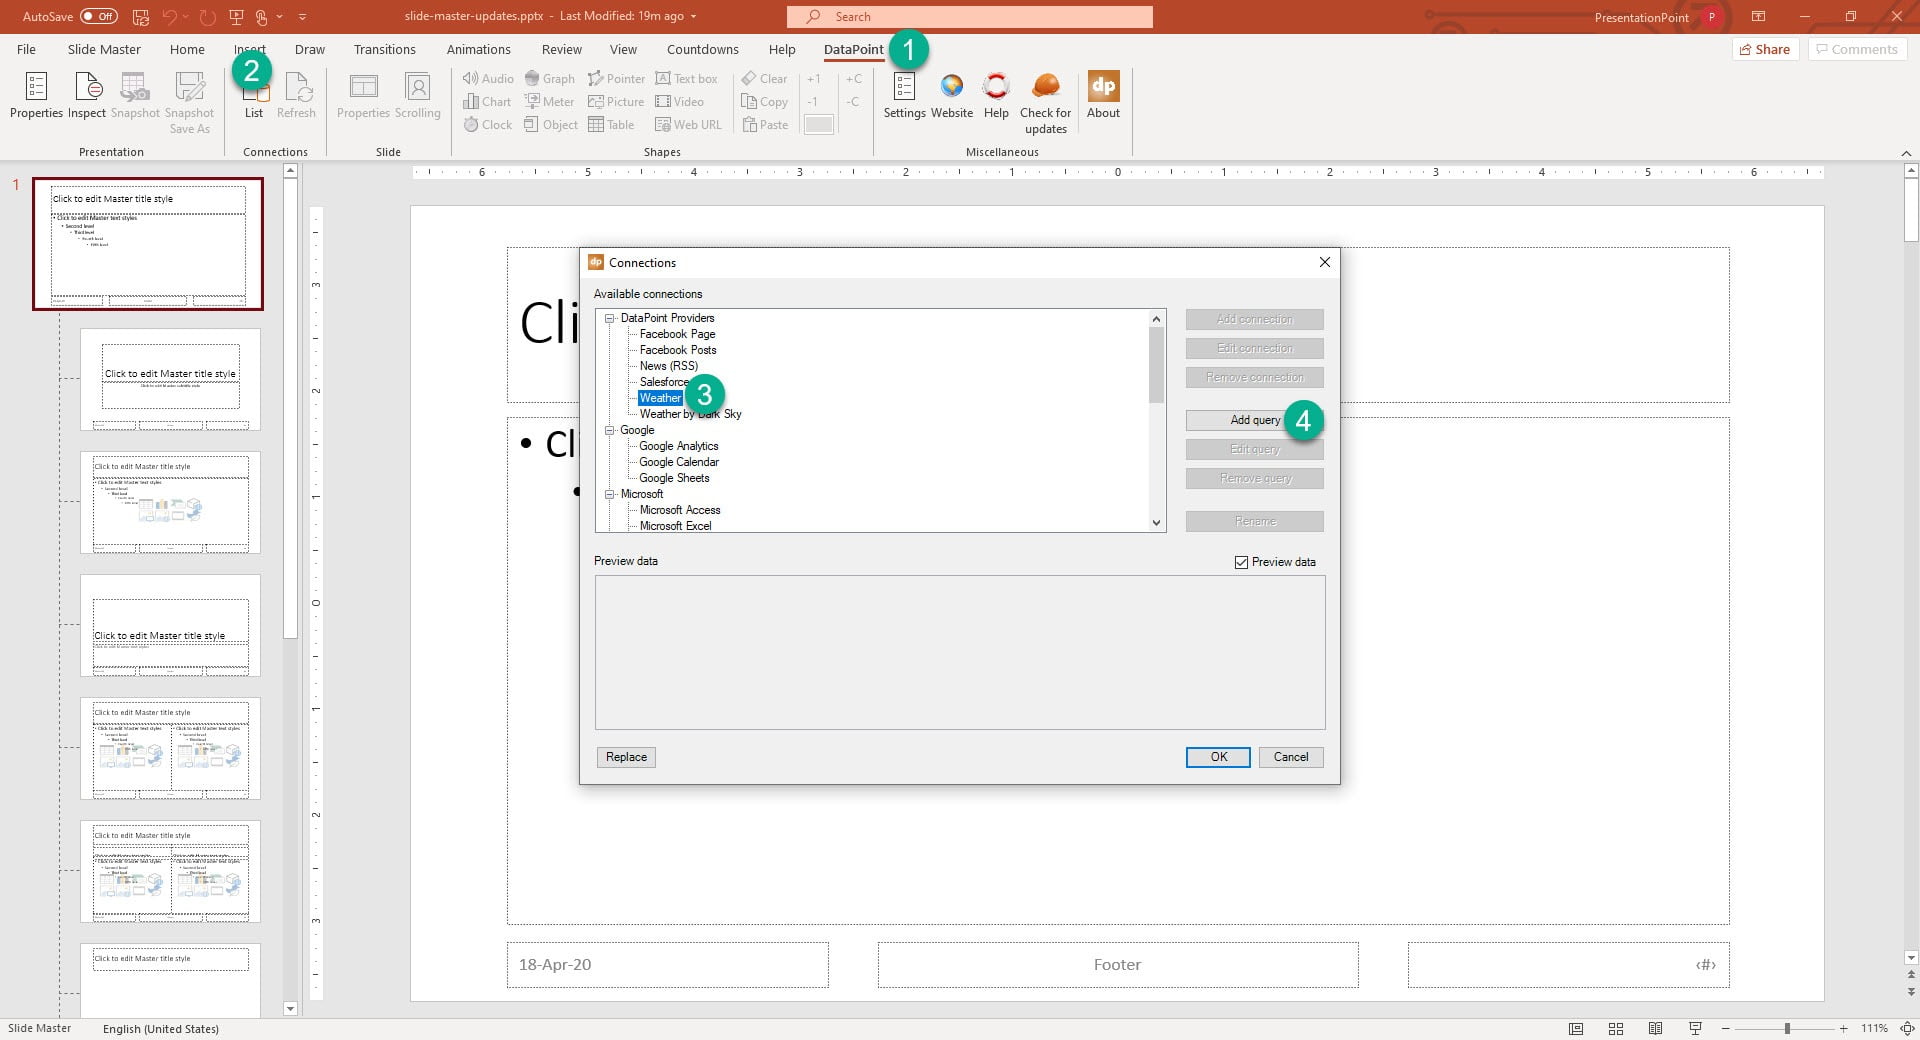
To make shapes dynamic, we click DataPoint and then the List button of the Connections group.
Next, you select the data provider from where you want to retrieve the information from. For this presentation here, we will use the weather data provider. Then click the Add query button to add a request or weather location.
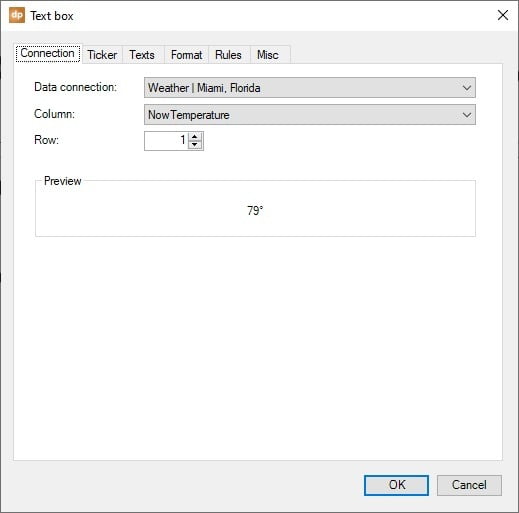
We are going to use a text box and bind that dynamically to the current temperature. Insert a text box to your slide master and link it to the desired weather column: NowTemperature here.
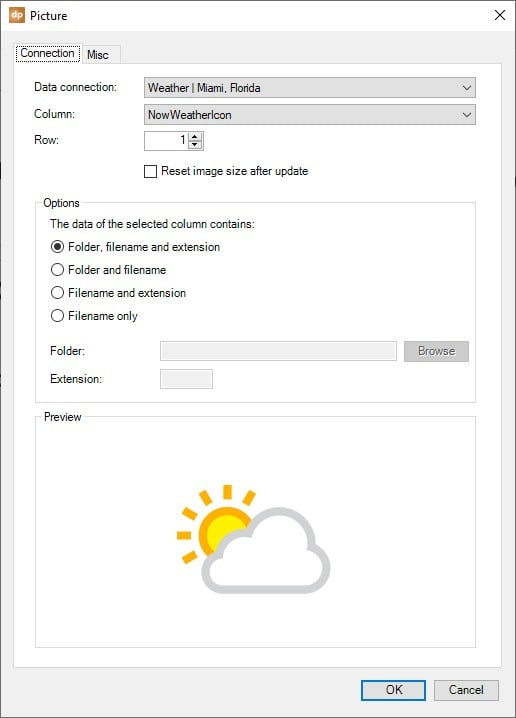
Place an image and link it dynamically to the weather icon.
Do some more work and customization and finally, we have this weather widget ready for use on our information screen.
Click Slide Master at the ribbon and then Close Master View to return to the normal slides.
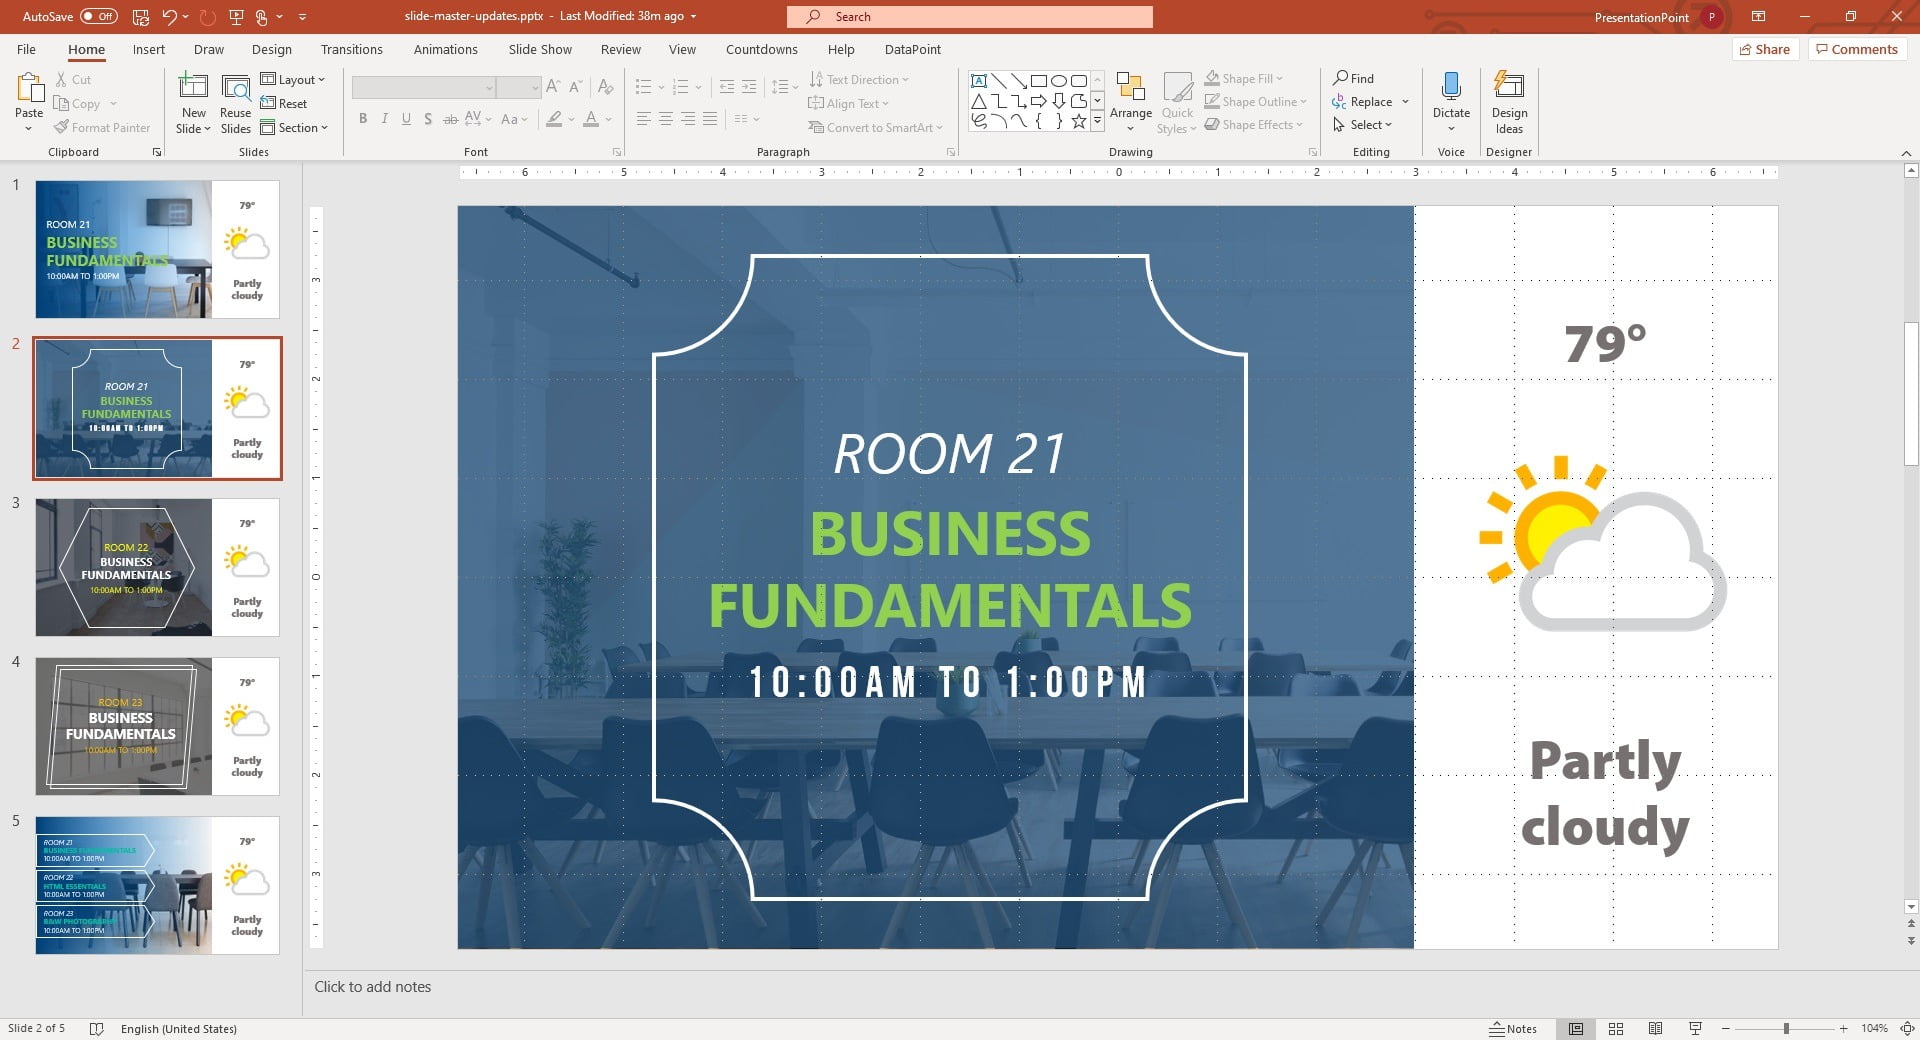
This weather widget is now visible on all slides of this presentation. Good thing is that the information coming from the slide master cannot be selected nor edited here. So that is extra protection.
Set the slide show type to a kiosk presentation. Set all slides to advance automatically after x seconds. Then run the slide show on a computer or television screen to run your own in-house information channel.
Start the 15-days free trial of DataPoint today. Do you need to send this presentation on a scheduled basis to remote screens, then have a look at our iPoint product.