
In this video, we show you how you can create personalized voter turnout videos using PowerPoint. The examples shown are for the US election, but will also work for any country, state, province, or municipal election. This could be used to increase voter turnout on a non-partisan basis or to improve voter turnout for your political party or to get people out to vote on a specific issue. The tool used in the video is DataPoint Enterprise edition.
Look at the video above to see how we created these personalized voter turnout videos and to see examples. So how did we do this?
Step 1: Gather Voter Turnout & Other Data
My first step whenever I am creating data-driven presentations or personalized videos is to gather the data I needed. In this case, my approach was to combine personal information about a voter with the issues important to them and then with the voter turnout numbers in their area in the last election.
The voter personal information and issues important to them could come from a poll or survey you did in their area or by having them fill out an online form such as a “Who should I vote for?” online quiz they could fill out and provide their name and email.
In this case, I just put in some sample information. The names are made up and any relation to any real people in these areas is not intended.
The voter turnout information is readily available online and I grabbed the real data from a government website.
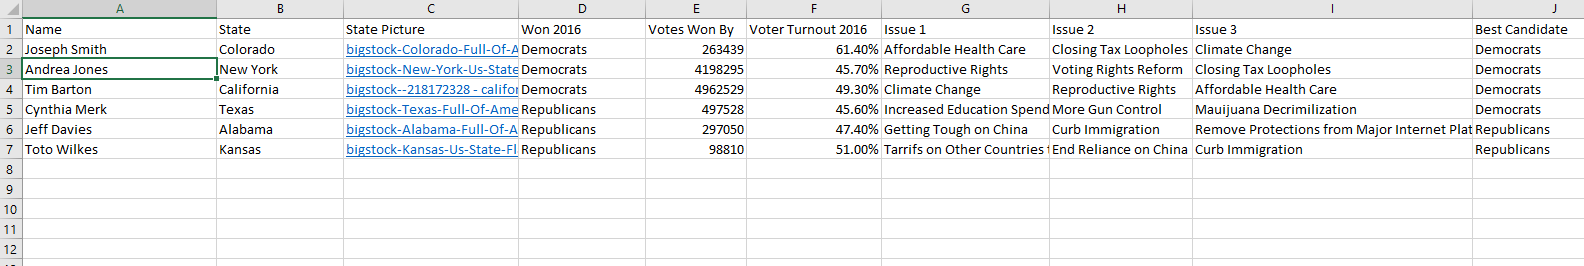
For simplicity’s sake, I put all the information in a single spreadsheet, but I could have easily had one spreadsheet with the voter information and issues and one spreadsheet with voter turnout and just combined them in the PowerPoint presentation.
Here is what the spreadsheet looks like.
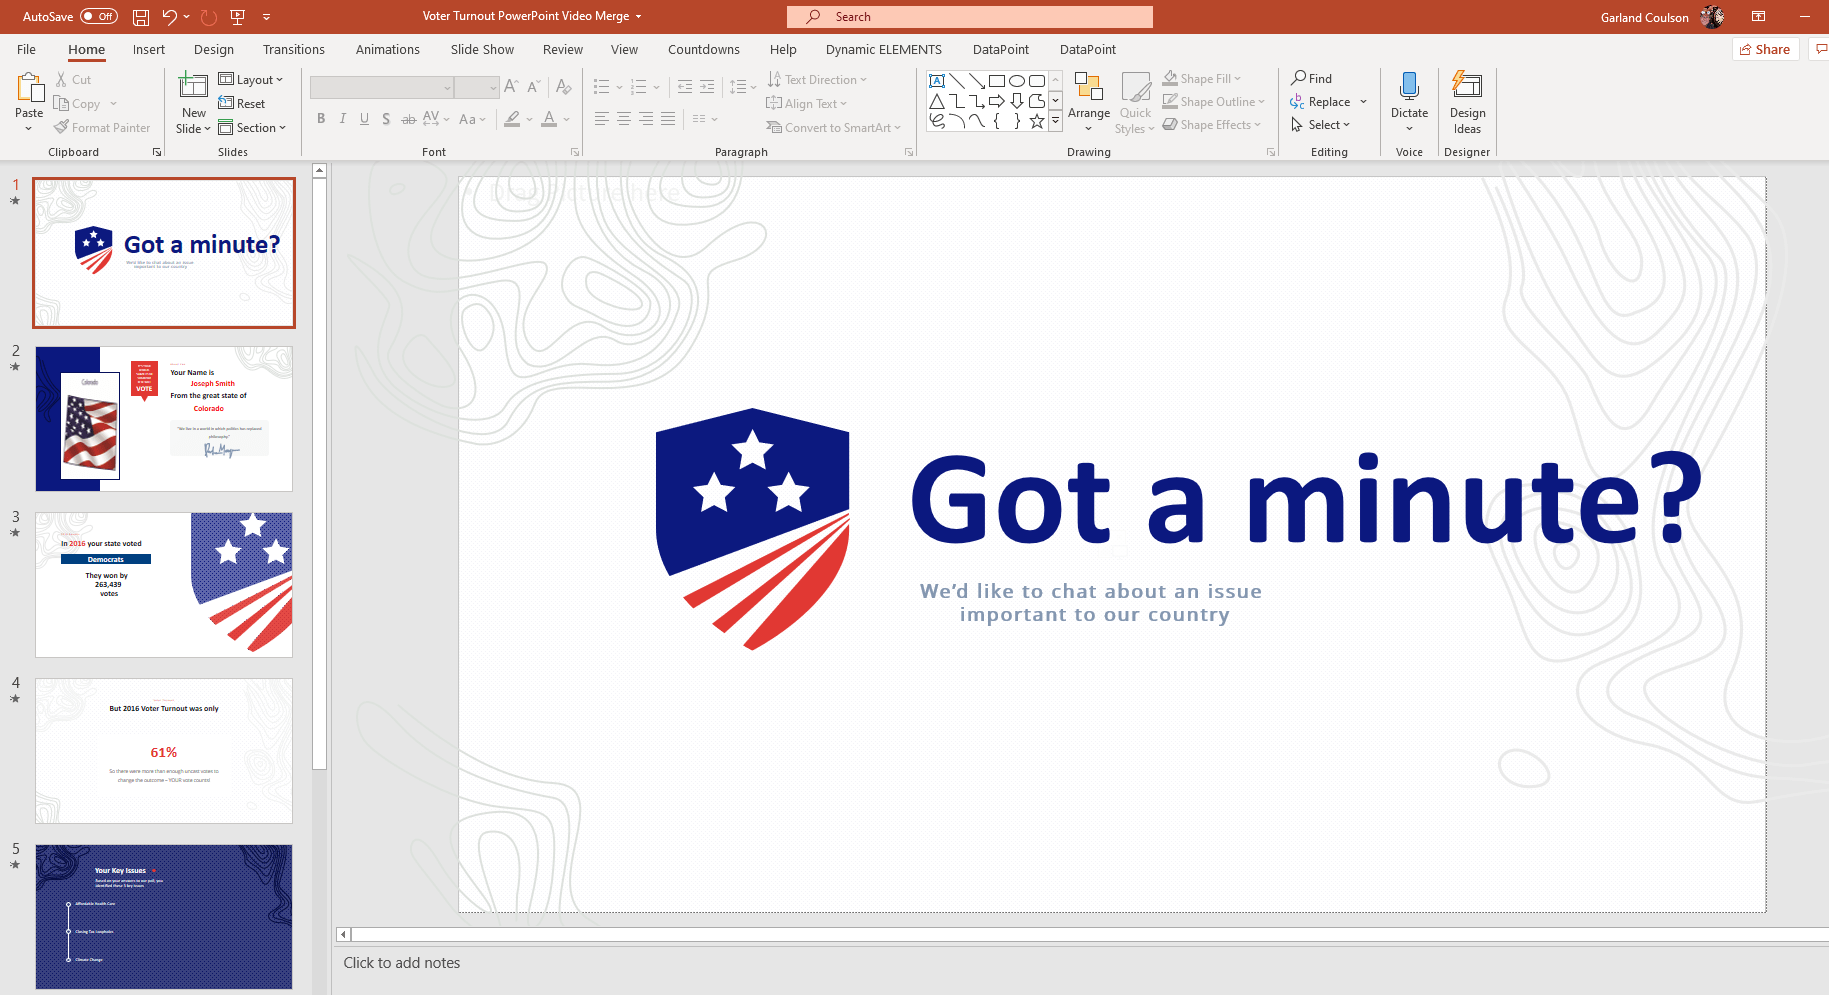
Step 2: Create a Voter Turnout PowerPoint Presentation
The second step is to create your voter turnout presentation in PowerPoint. I started with a template I found online and created the presentation to tell the story I wanted to tell to the recipient.
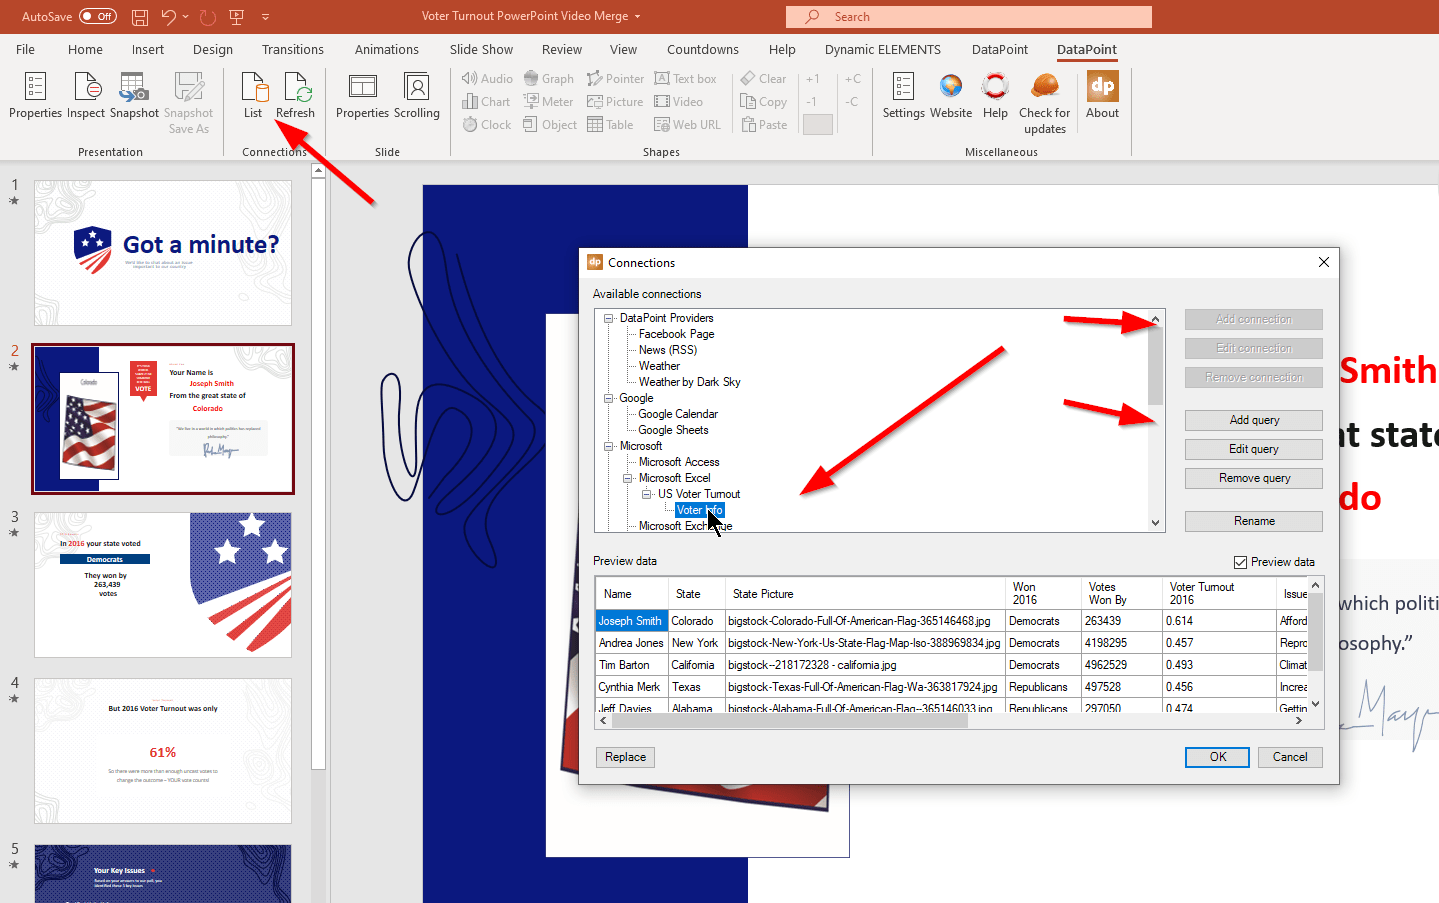
Step 3: Connect Voter Turnout & Personalized Data To Presentation
Next, we create our voter turnout data connection in the PowerPoint slide by clicking on the DataPoint ribbon at the top in PowerPoint and choosing [List] and then [Add Connection] to connect to our excel spreadsheet, then [Add Query] to see our data in the spreadsheet.
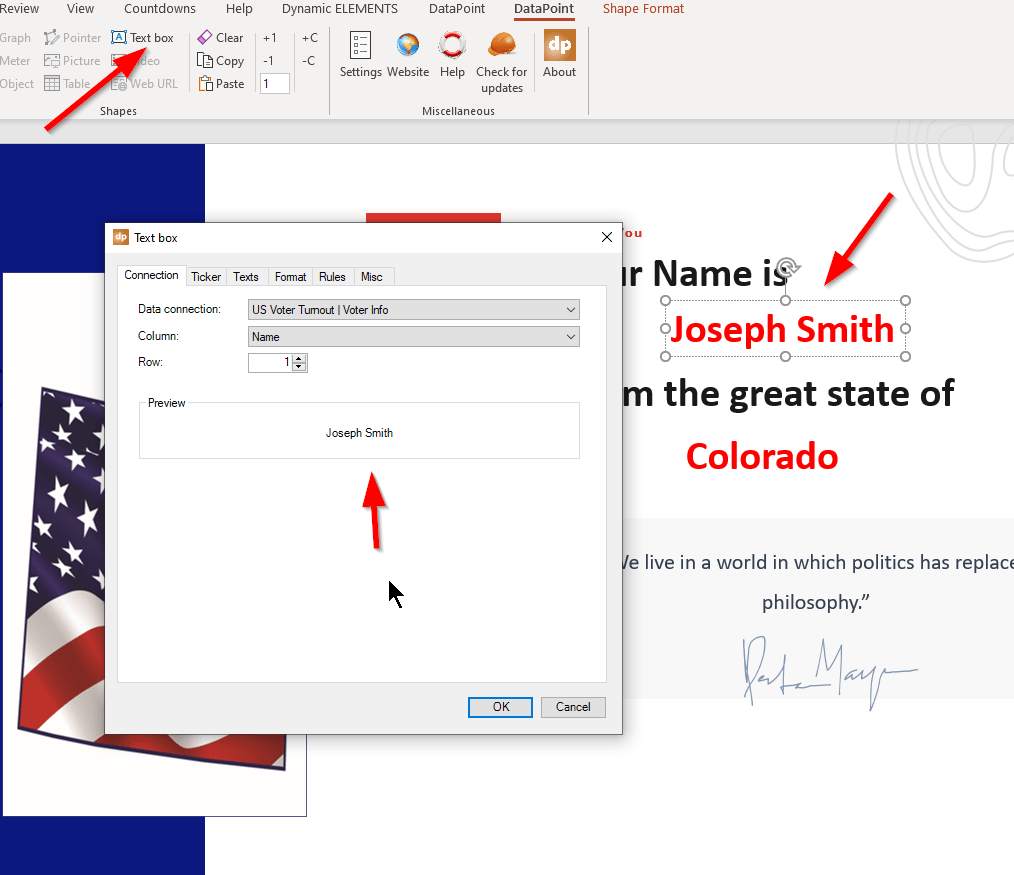
Step 4: Connect Text & Image Boxes to Data
Our next step is to add text and image boxes (for the map pictures) to the presentations, and then to connect each text box to the data. For example, here is how we connected the name text box to the data.
Then we connected other text boxes to data such as state, voter turnout, issues, and last election results.
Step 5: Enable Data Scrolling
Turn on data scrolling so the presentation knows to use the data from more than one person.
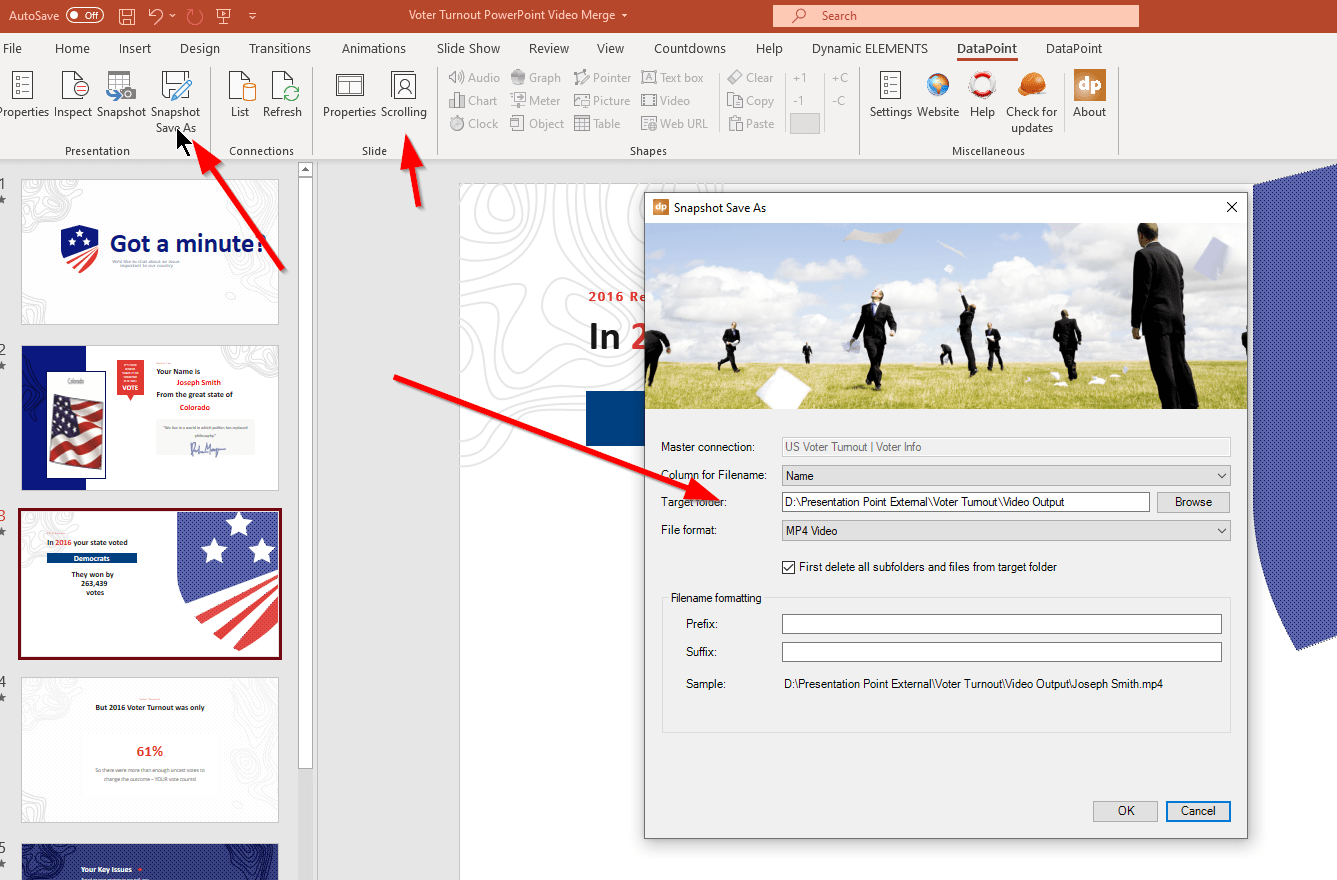
Step 6: Save Snapshot as Video
Then use the DataPoint Enterprise [Snapshot Save As] command to create snapshot presentations as mp4 videos.
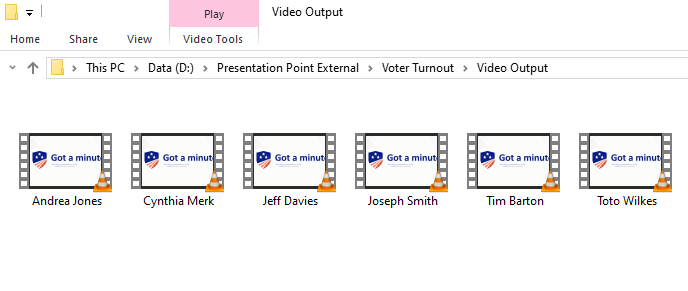
Step 6: Review and Distribute Your Videos
Open the folder you chose for video output and you will see all of your videos with personalized information, ready for distribution!
We hope you have enjoyed this video and article. Please share it with others you know would be interested. Contact us if you have any questions on how to create personalized videos with PowerPoint or any other questions.
You can find out more about DataPoint Enterprise here.

