
How can this be used?
This could be used by broadcasters or YouTubers who are doing political commentary or to display live election results in coffee shops or waiting rooms or on other digital signage. It can also be used in conference centers at political rallies.
What methods are we going to use to update the data on your live election results? Here are two options:
- Connect to an Internet Image
- Connect Directly to a raw Data Source
Live Election Results from an Internet Image
A simple way of showing updated results is to piggyback on a web site that is already displaying live election results. Here is an in-depth article on how to display automatically updating images in PowerPoint. The example used is a hurricane watch, but it can easily be used for live election results as well.
The drawback of the Internet image method is that you are reliant on an outside source for updates and you have to show the branding on the image you are using.
You have more control by showing live election results from a data connection where you control the graphic look and data better.
Live Election Results from a Data Connection
Now let’s show you how to display live election results by connecting your PowerPoint presentation directly to the data. The DataPoint software that we use for this lets you link to a wide range of data sources including:
- Microsoft Excel
- Json
- Xml
- RSS feed
- .csv
- MySQL
- Microsoft SQL
- Microsoft SharePoint
- oData
- OLE DB
- ODBC
For the purpose of this article, we will show you how to connect to a Microsoft Excel spreadsheet.
Live Election Results from Microsoft Excel
To start, you will need to create an Excel spreadsheet that will hold the updated results. You can either type the updated information into the spreadsheet or export it from another source into Excel or .csv format.
Here is a sample of what the spreadsheet might look like.

The next step is to create your design in PowerPoint. If you aren’t comfortable designing it yourself, check out our PowerPoint templates or our custom PowerPoint design service.
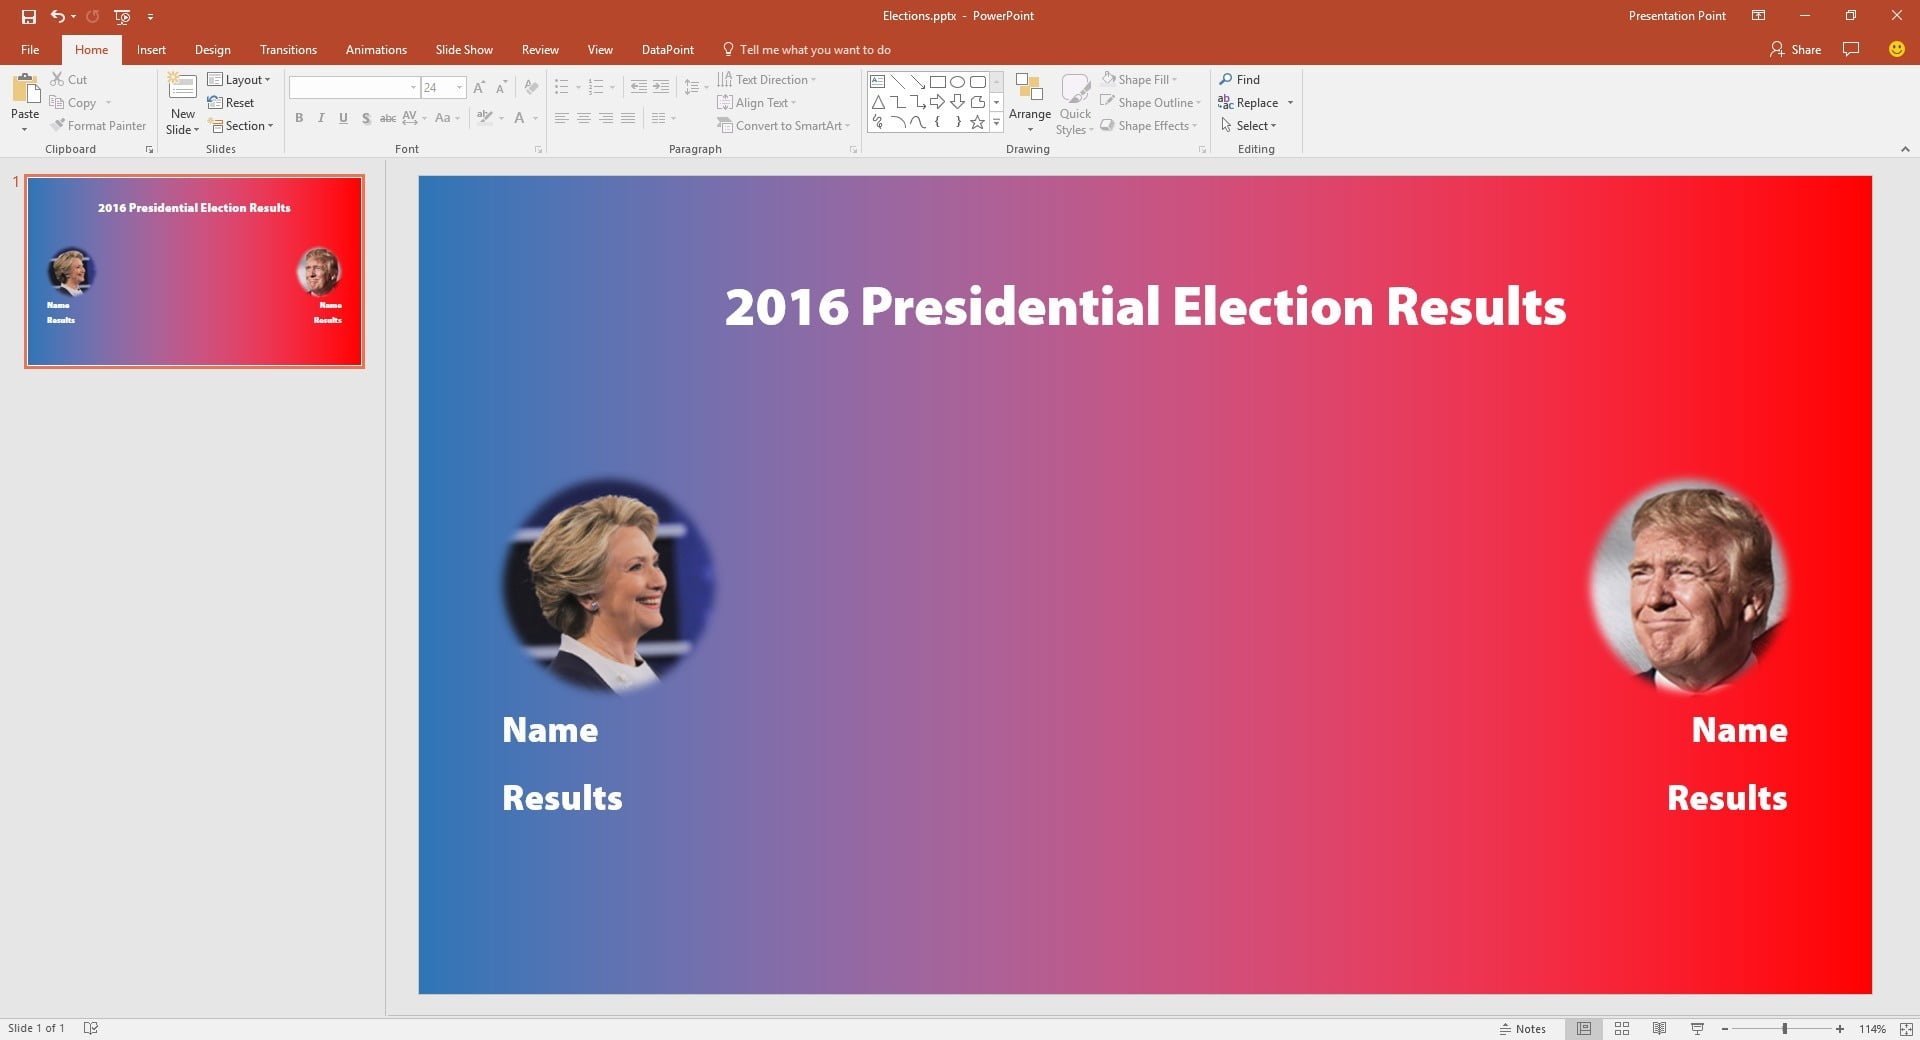
Here is a simple example we put together for this article.
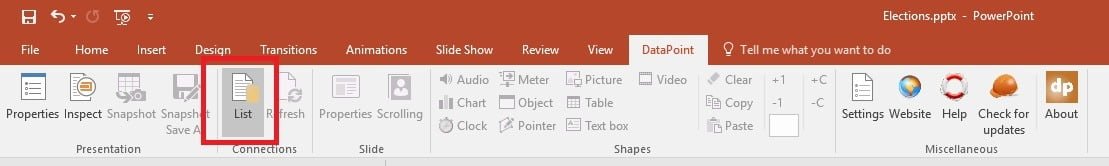
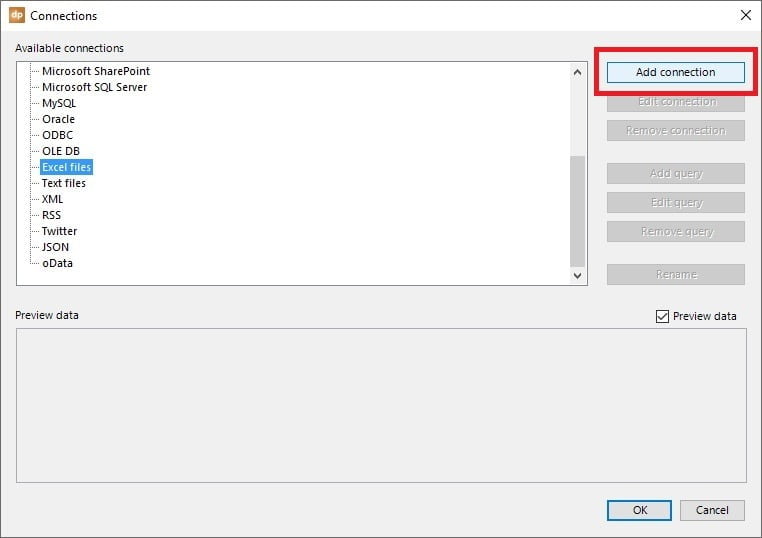
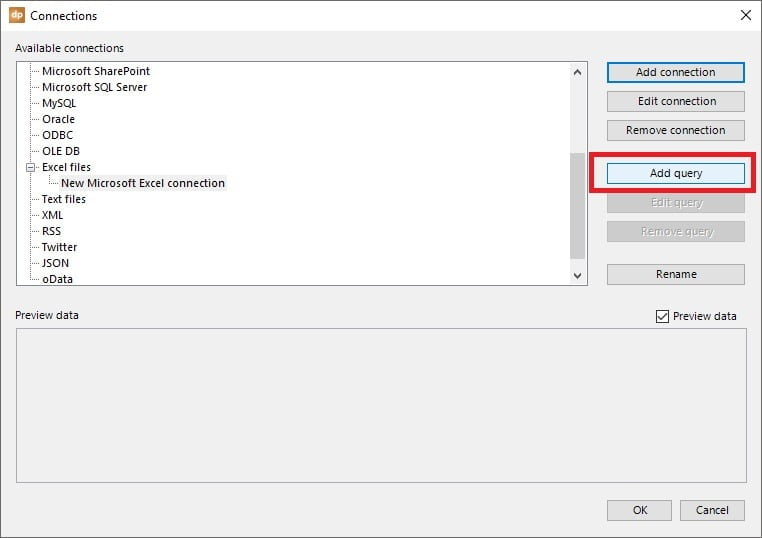
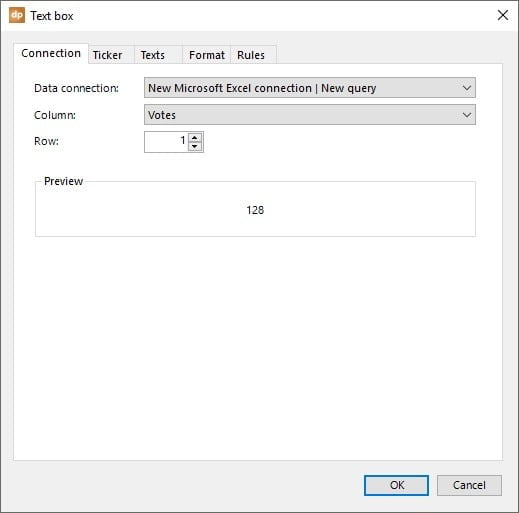
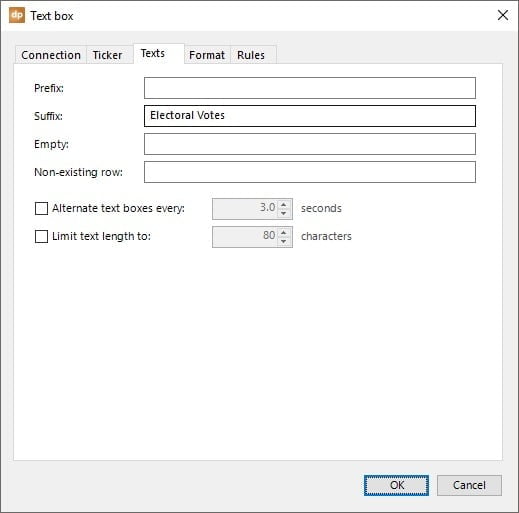
Within PowerPoint with DataPoint installed, you click on the DataPoint tab, then List menu. A Window will come up showing the available connections. Choose Excel files and then the Add connection button.
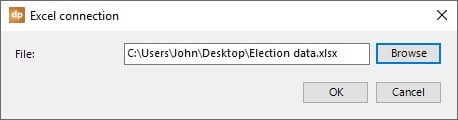
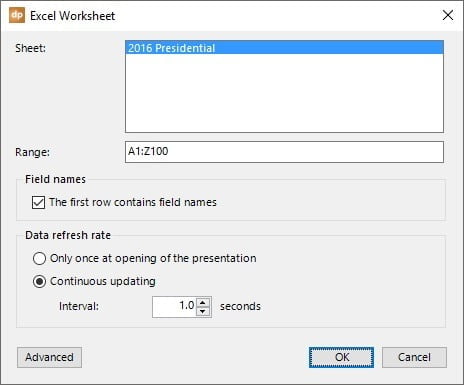
Click on the OK button.


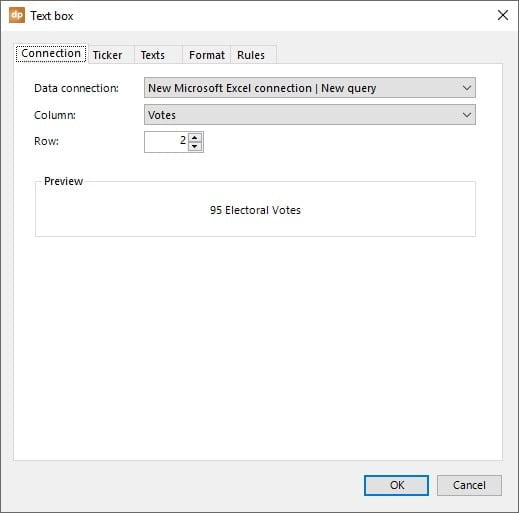
Live Election Results Now Displayed In Your Presentation
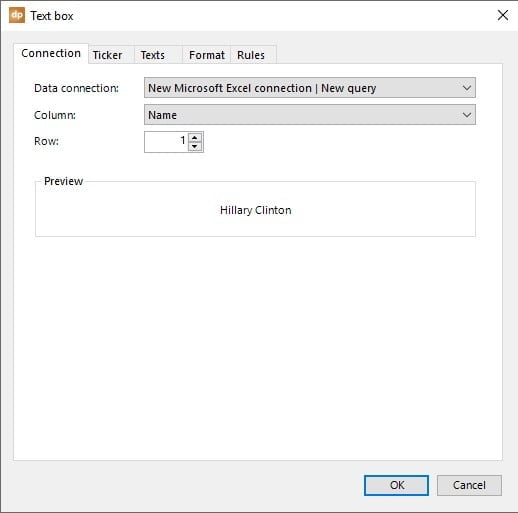
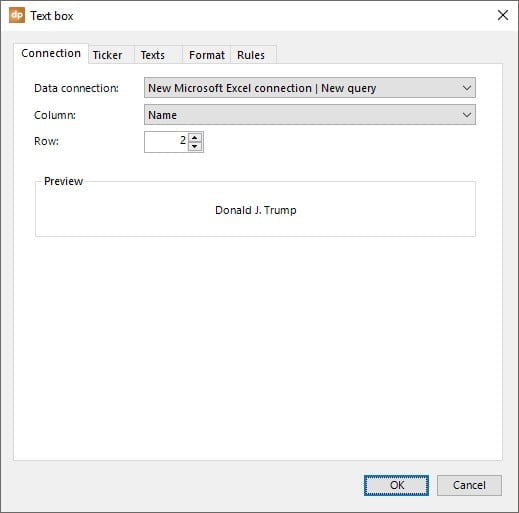
Now you can see the election results are now displayed in the presentation and will automatically update as the data in the Excel spreadsheet changes according to the intervals that you set your data feed to refresh your presentation.


Hello,
Would you please be able to send me a video link that how this will work.
And will the live Election result will be able to be seen on the webs and social media channels?
Sure, look at this https://www.youtube.com/watch?v=MJBr55Fqw5M for elections and this as another explainer video for weather https://www.youtube.com/watch?v=inCFNwhQsIc. See how easy it is to use.
Please can you get me a sample powerpoint file for the above
Sure, see PM.