
Do you want to show your Google Analytics data, and KPI’s in real-time on a television screen? Or maybe you want to open your PowerPoint presentation or report with Google Analytics data, and immediately look at the latest updated information without doing a thing? Or generate multiple slides with Google Analytics data automatically? Then I have good news for you.
Google Analytics is a very important source of information for companies, marketers and sales managers. When a new product is launched, or a new strategy is implemented, then you need to closely watch and monitor the evolution of the website. And the visitors going deeper into our new websites, are we getting more visitors etc.
We have added a new Google Analytics data provider to our DataPoint plugin so that you can show Google Analytics data on your slides. Link one time, and report forever.
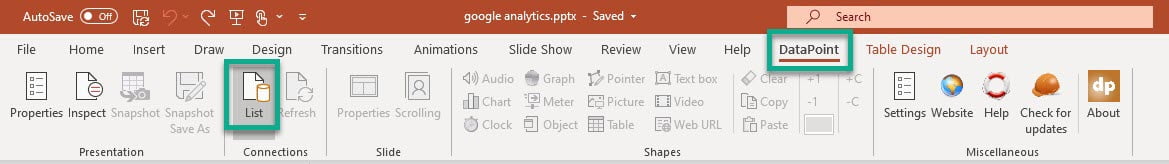
To connect your PowerPoint to your Google Analytics account, use the DataPoint plugin from your PowerPoint ribbon. At the connections group, click the List button.
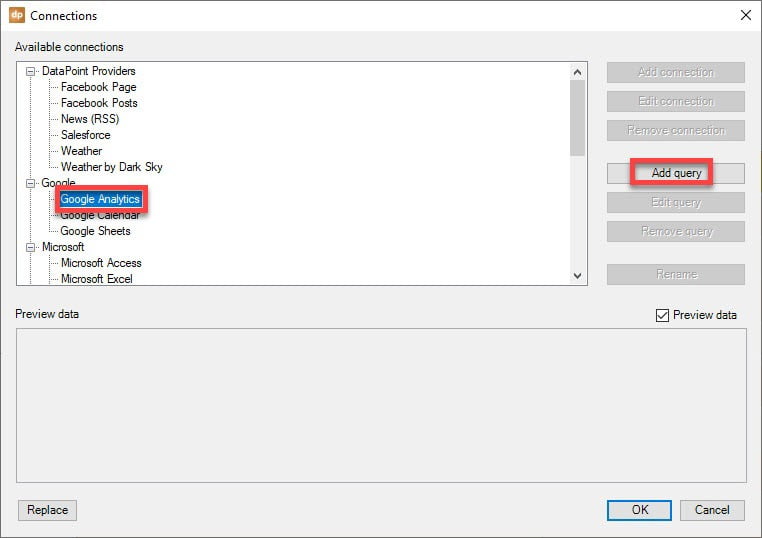
Here you see a list of an available data providers. At the Google section, click to select the Google Analytics data provider, and click the Add query button.
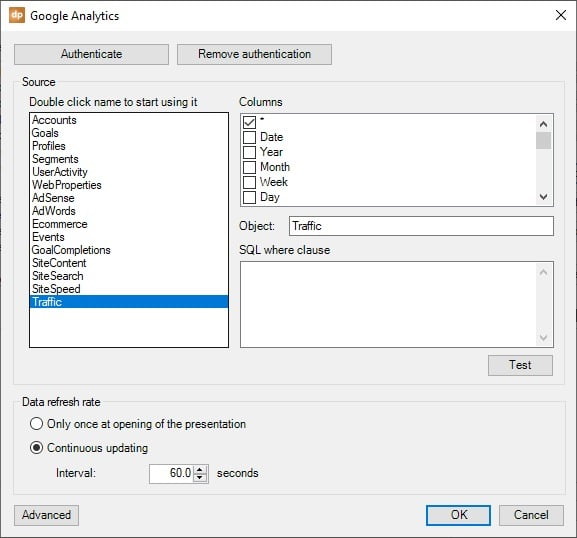
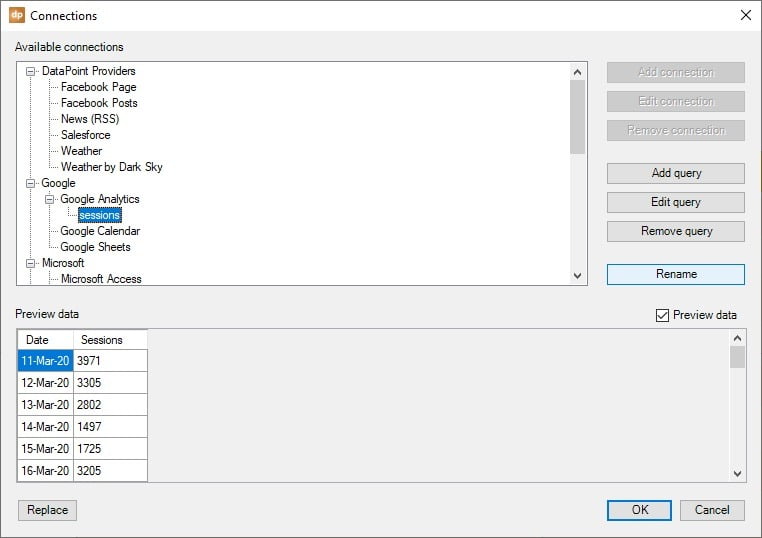
After authentication, you will see a list of tables or data stores that Google Analytics has for you. Choose the data table that you want to use in your reports. Double click the table name of your choice and you will see the available data columns of this data table at the right. Google is restricting its access a bit so we just cannot request everything. A given limitation is that we can only include 10 columns.
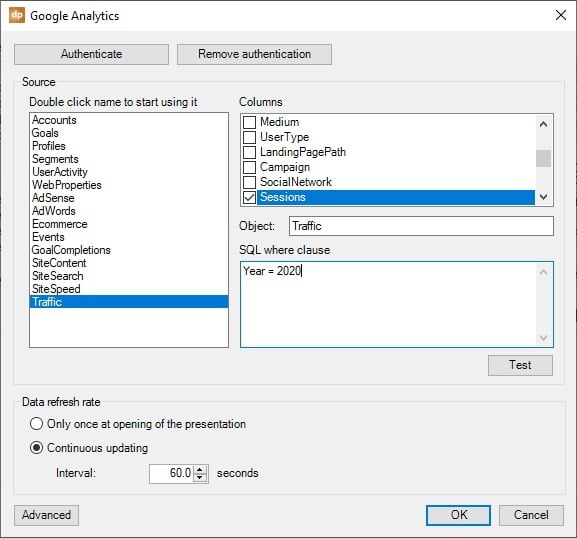
So check the columns that you want to investigate. Optionally you can set an additional filter or where clause to limit the data e.g. year = 2020 and month = 4. Hit the Test button to check the validity of your where clause (don’t include the WHERE word yourself).
For the self-updating KPI dashboard, you might want to adjust the data refresh rate that DataPoint is using to check for new data.
Hit OK to close.
Give the query a meaningful name. You can see already the data here at the preview area below.
Use a normal table and design it as you want it to look.
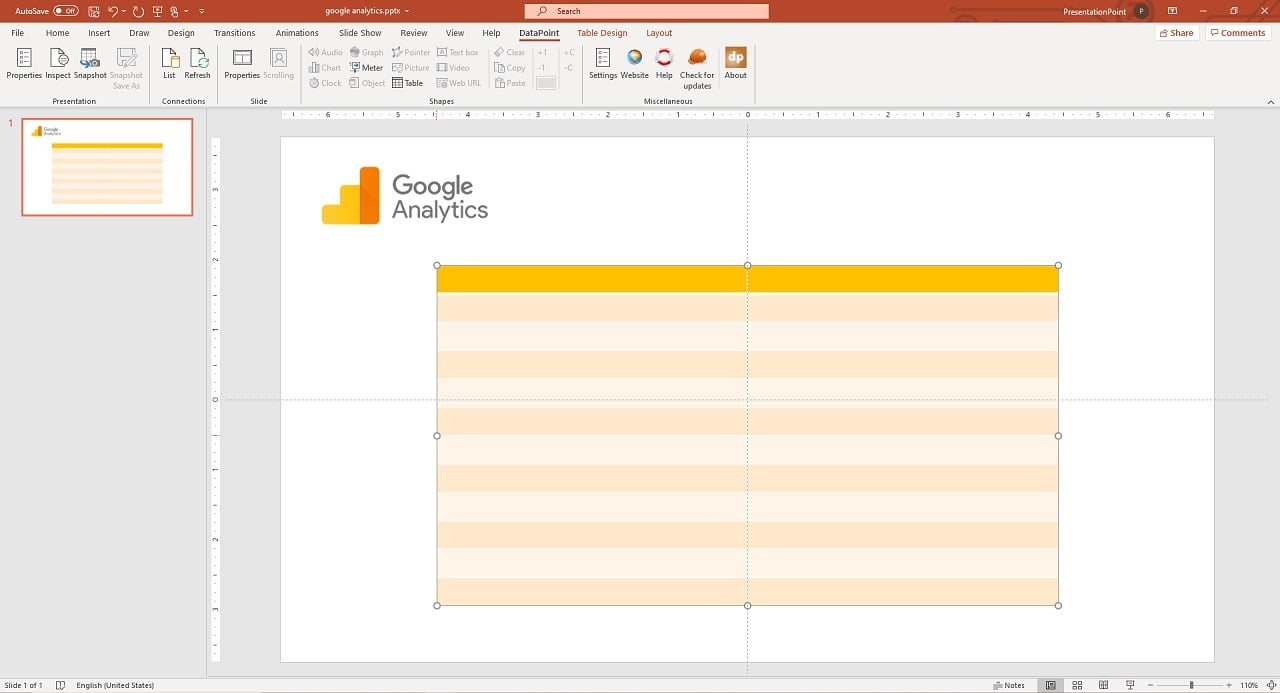
Select the table and click the Table button of the DataPoint ribbon. Link it to your Google Analytics data. Optionally let DataPoint copy in the column names.
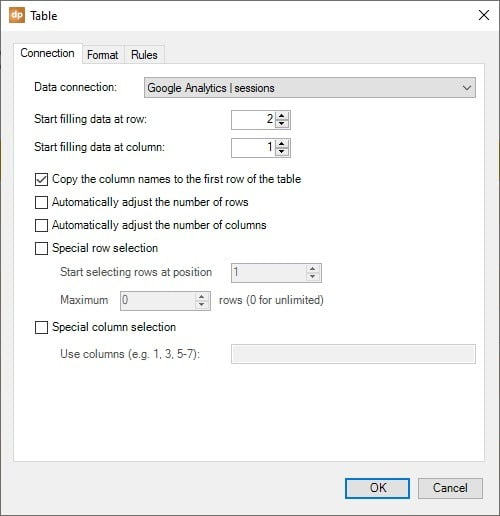
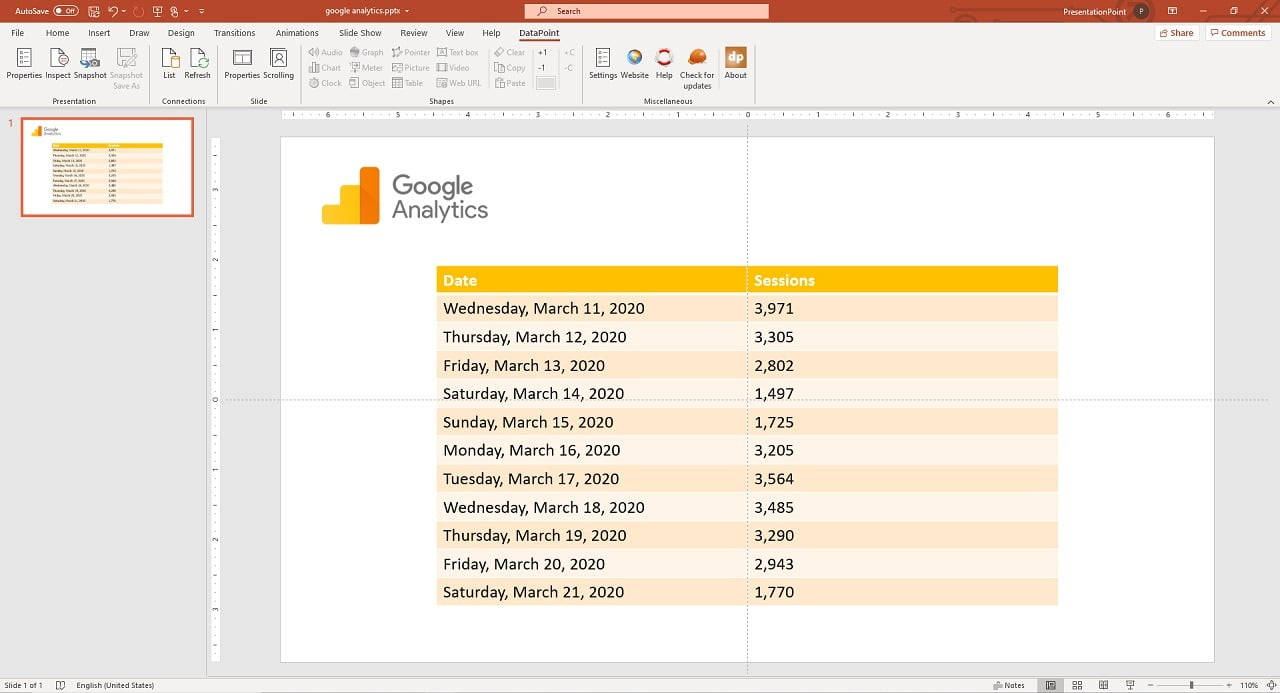
Hit OK and your table is now linked dynamically to your Google Analytics data.

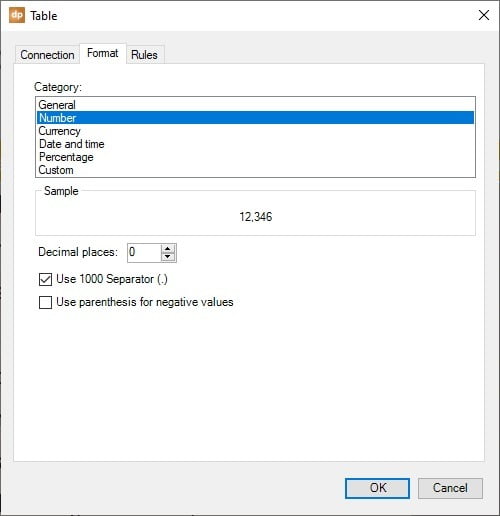
Let’s make it better. We need to format some cells. Select the cells with the dates (which are date times here) and go back into the DataPoint table properties. Select the Format tab. And set it to the date format that you want to see in your table.
Do the same for the number cells. Set it to format as a number and check to use thousand separators for a better readability.
Our table is nicely formatted to present our GA data. Next time you open your presentation, it will automatically show the latest figures. Or you can run this as a slide show, and see the data changing automatically.
Use data scrolling when you want to create a snapshot presentation with multiple slides.
Get in the latest DataPoint version if you have a license. Or start your 15-day free trial now.

