In this article, we will discuss how you can use our tools to create a Twitter wall.
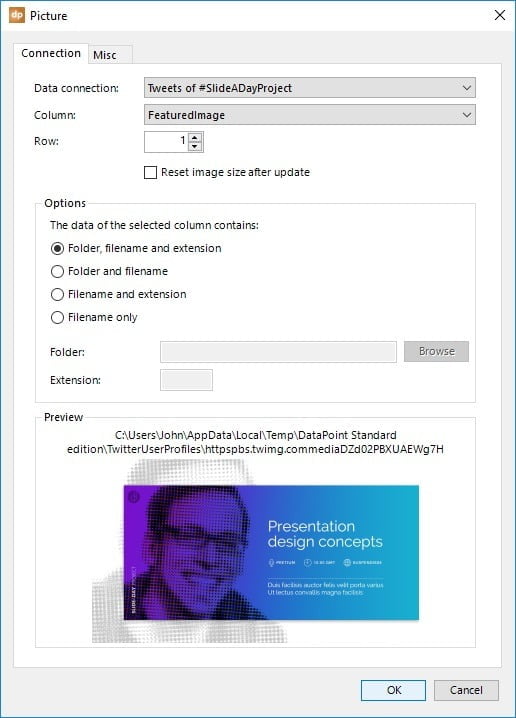
We revised our Twitter data provider and it can now display a profile image and the featured image of a Tweet.
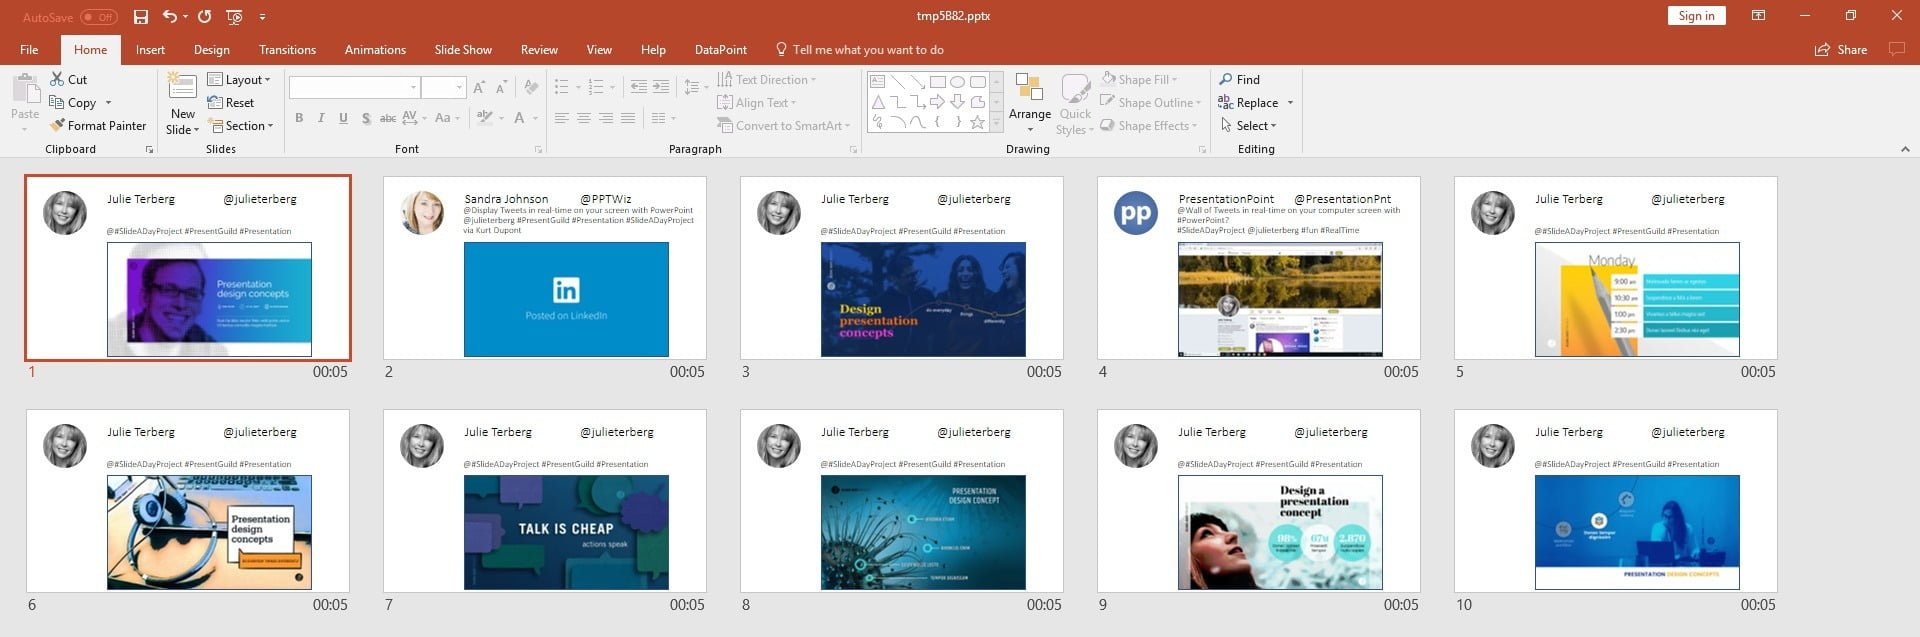
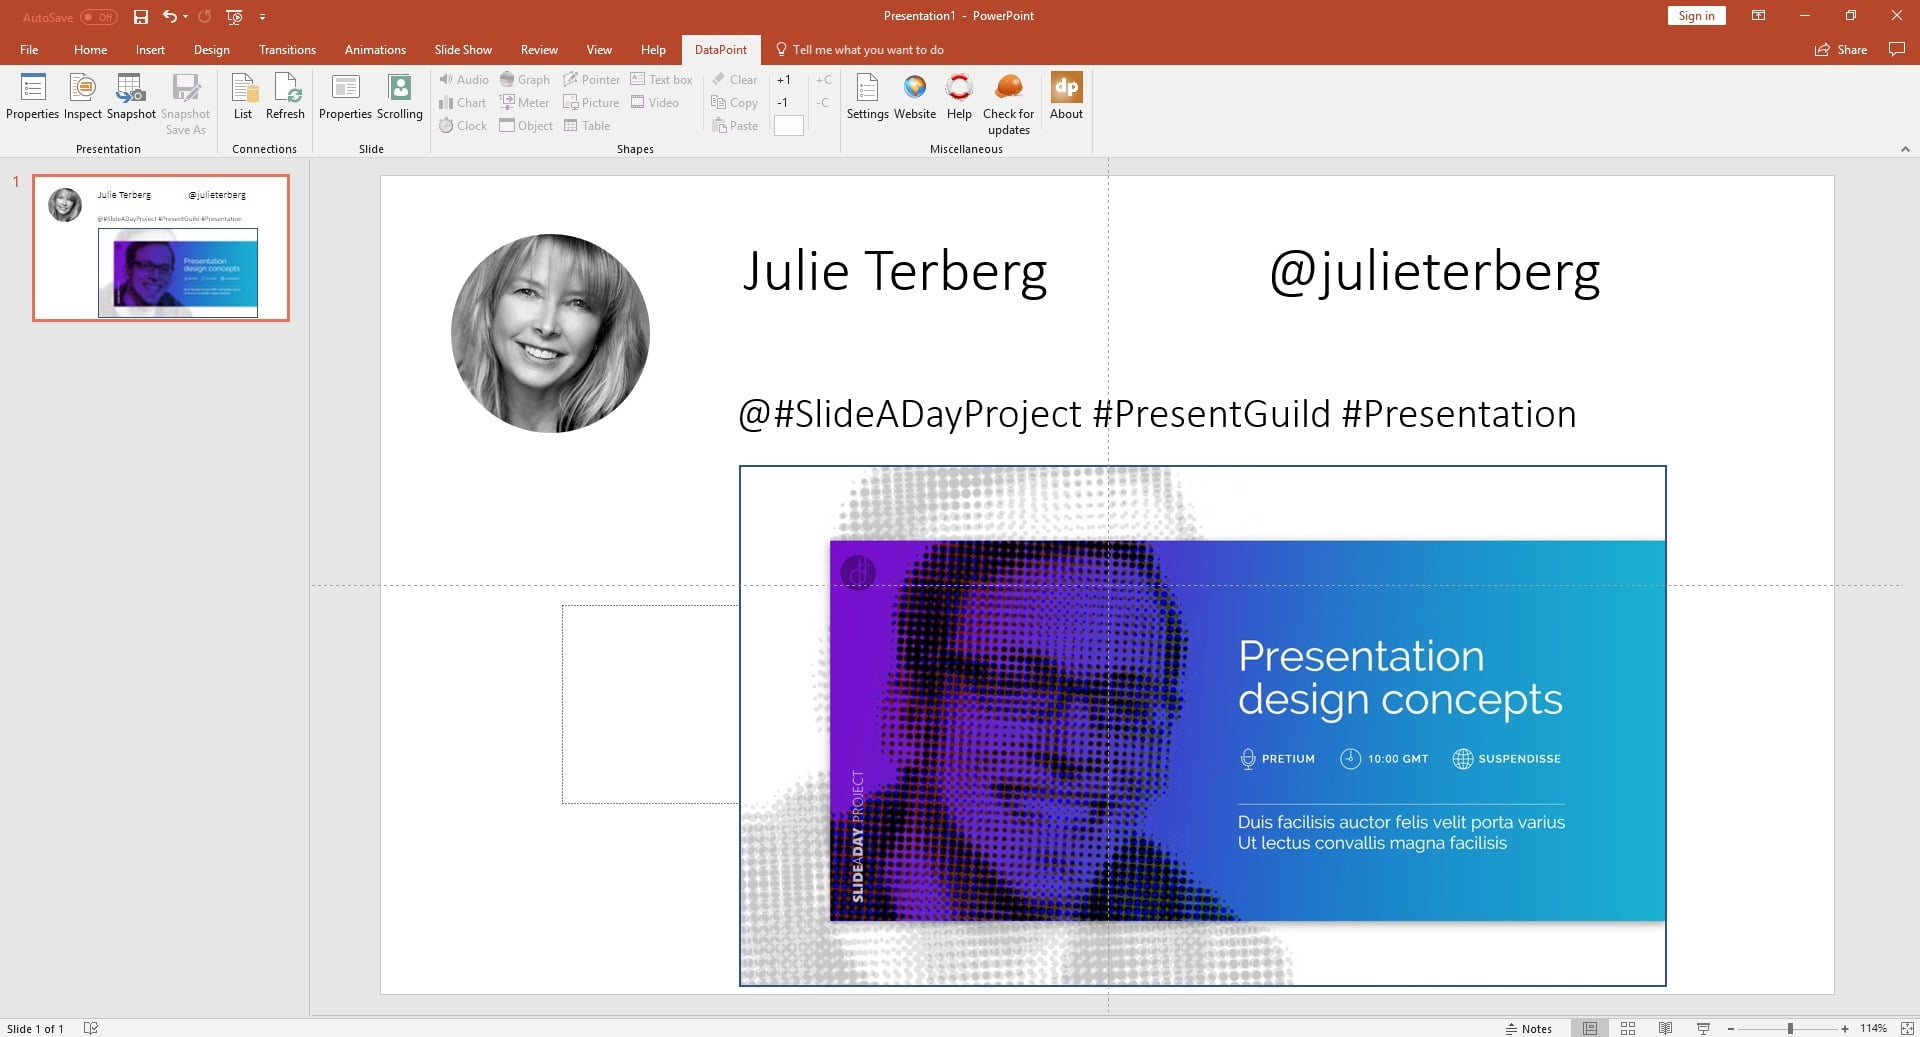
In this example, we will create a Twitter wall feed from a PowerPoint MVP. There are not that many PowerPoint MVP’s in the world. A PowerPoint MVP stands for Most Valuable Professional and it is a status that Microsoft gives to individuals that share their knowledge on a given Microsoft product to the world.
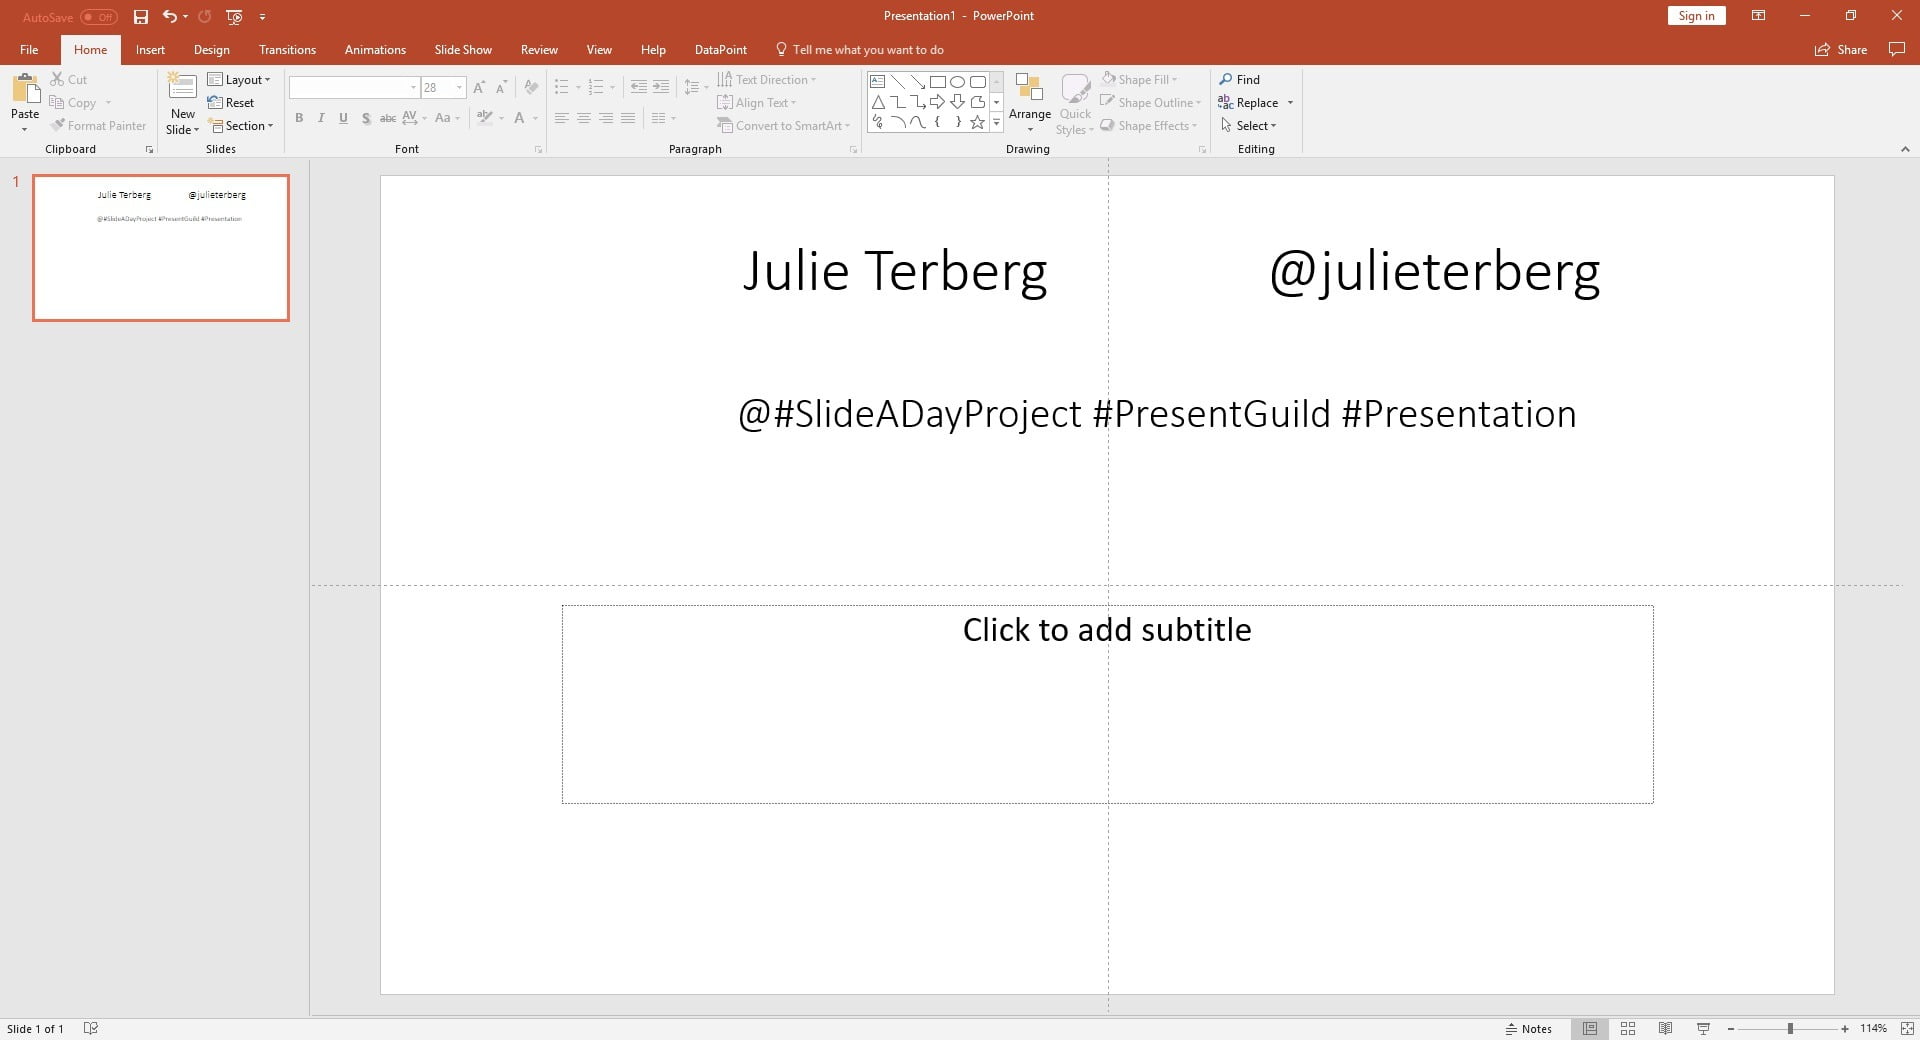
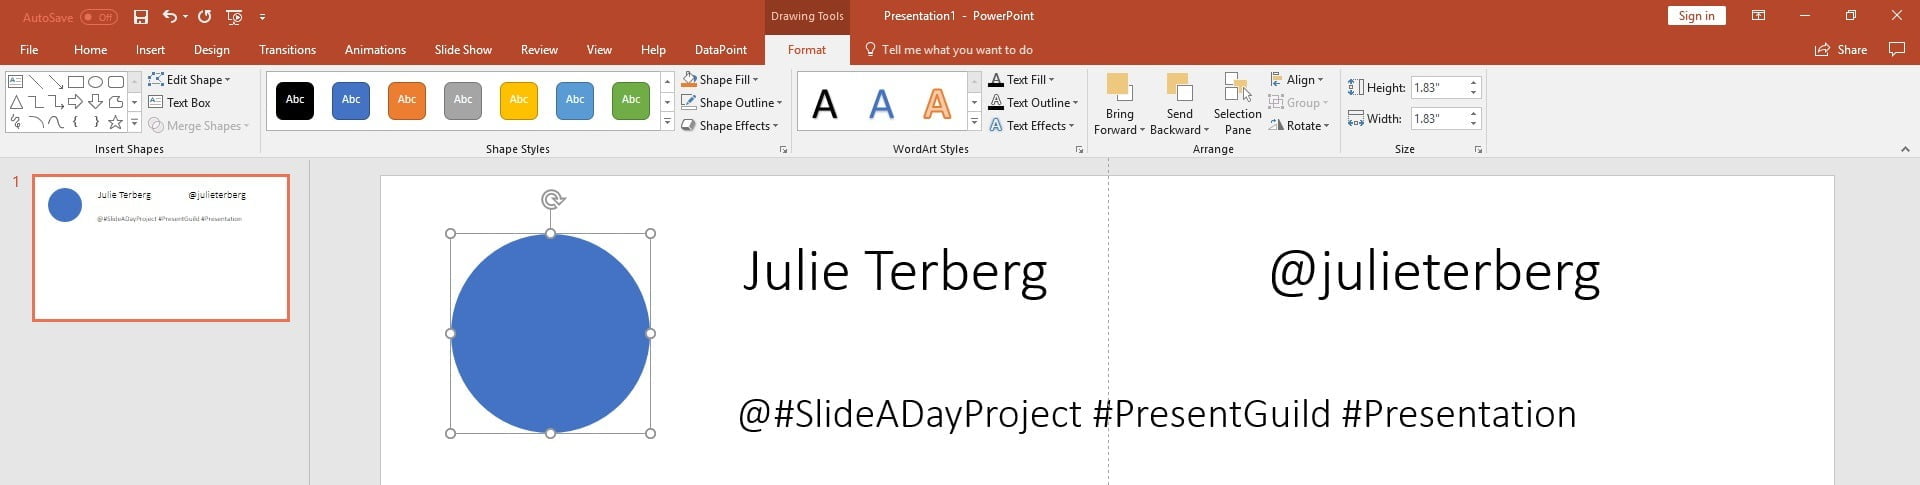
 One of those Microsoft MVP’s of PowerPoint is Julie Terberg. She is a great designer and she has a special ‘hobby’ to publish a nice designed PowerPoint slide everyday on Twitter. Have a look at #SlideADayProject on Twitter and you will see astonishing designs. Her slides are typically recognizable by a great photography as a background image and then on top of it, some texts in harmony with the image.
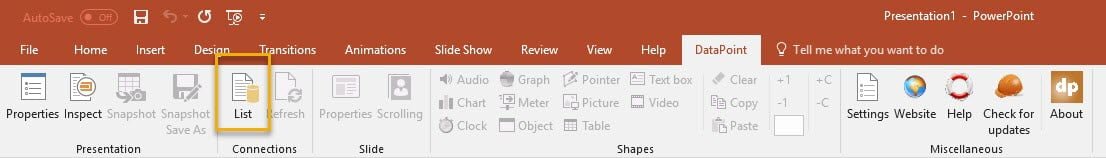
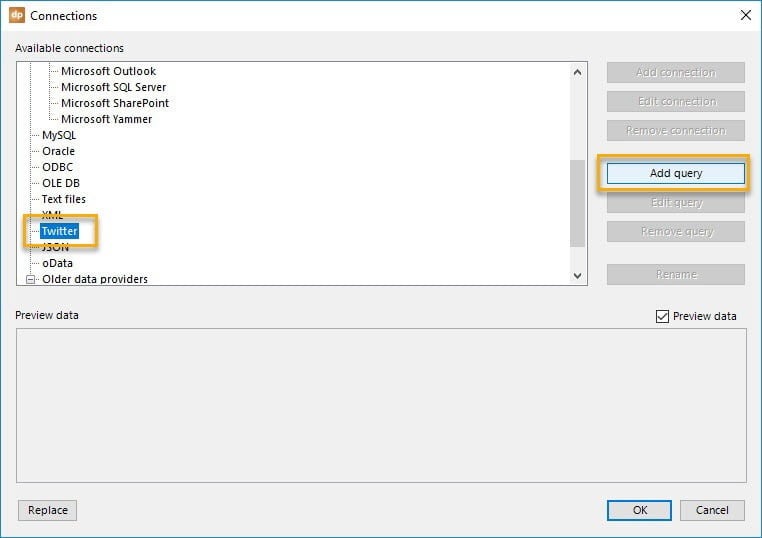
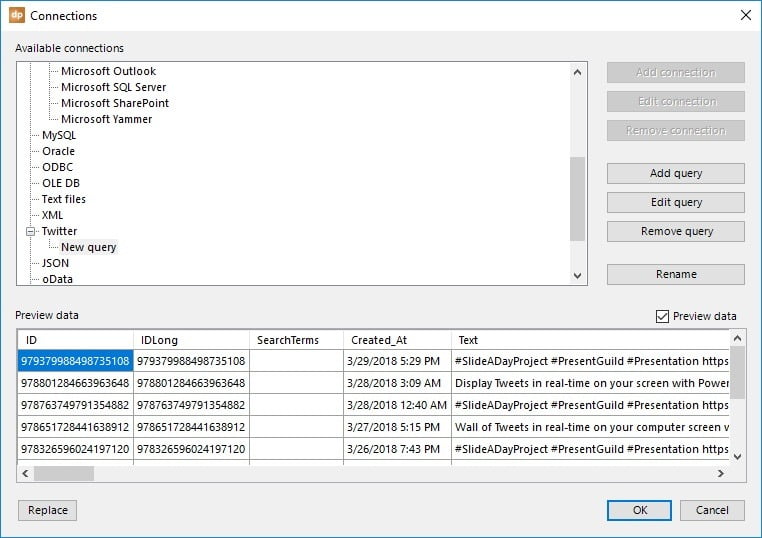
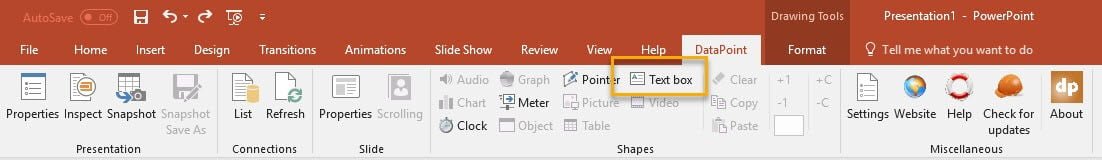
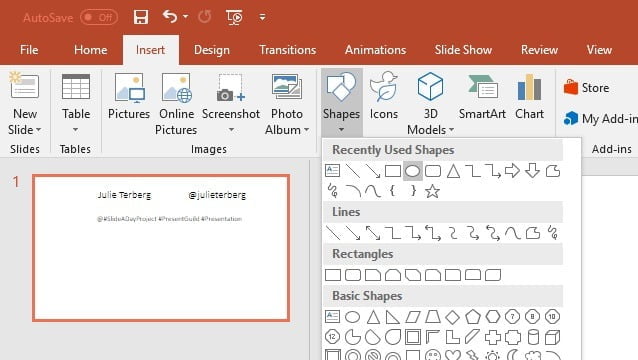
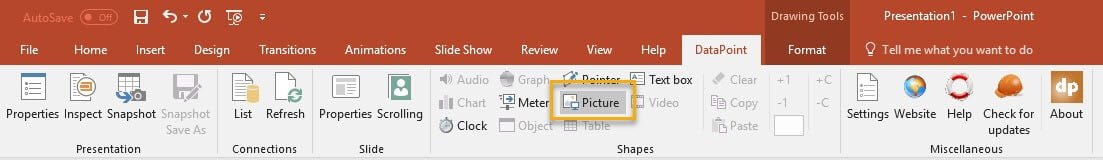
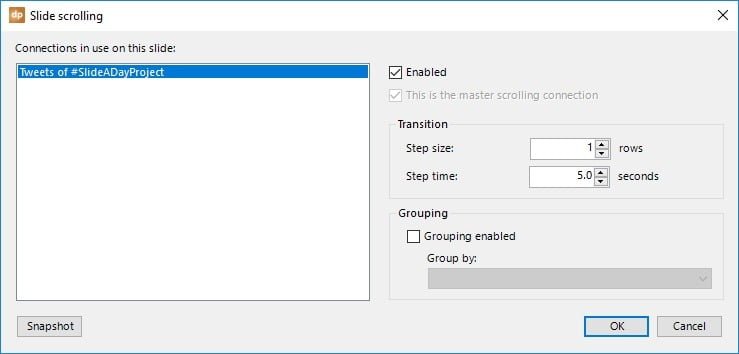
So with the latest release of DataPoint, we updated the code of our Twitter data provider. Click to open the DataPoint menu from your PowerPoint menu or ribbon. Then click the List button of the Connections group.
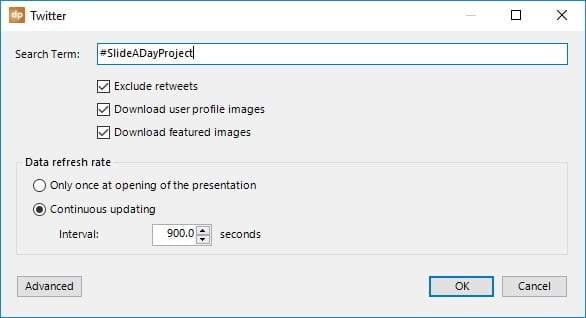
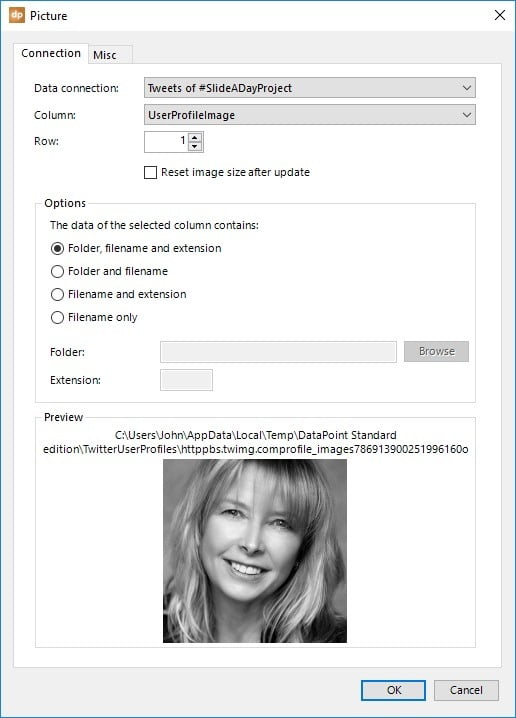
Download user profile images and download features images will prepare a local copy of the images. This option will slow down the processing a bit since more work is involved.
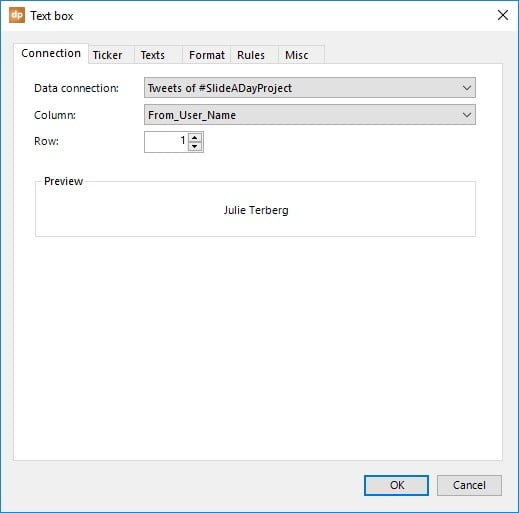
Finally set a refresh rate for automatic updates during the run of a slide show.


You could also click the Snapshot button. This will create a new presentation with a Tweet per slide. This snapshot presentation can easily be sent to others that are not so lucky to have DataPoint on their system.