

Another presentation make-over. This time of the Staten Island Ferry schedules screen. The Staten Island Ferry is a passenger ferry transportation system and connects Manhattan and Staten Island. The ferry operates 24/7 with boats leaving every 15 minutes at peak times. It transports 22 million, people a year for free between the 2 terminals; Whitehall in Lower Manhattan and St. George in Staten Island. It is used by commuters, and also known by tourists because it takes you along the status of Liberty for free. We went on it.

We departed from the Whitehall Terminal in Lower Manhattan on a sunny afternoon, and we spotted these information screens in the terminal. Personally I would suggest a make-over of the design itself as everyone can see that this screen was created already in PowerPoint with some default settings of PowerPoint shapes. We guess that they are not yet using DataPoint, but have some custom VBA coding behind it or a local Excel file that they update.

PowerPoint Connectivity
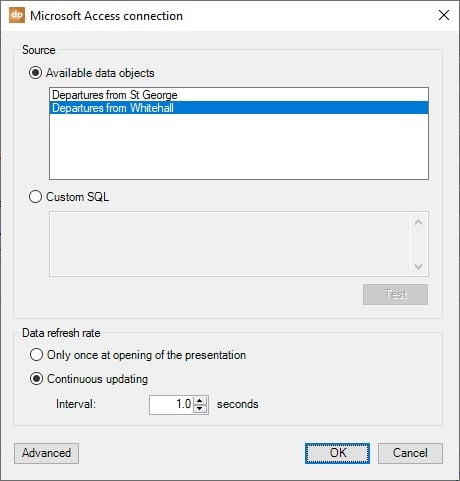
But OK, it is our bad habit to create fast data-driven and real-time make-overs of screens that we see with our DataPoint tool. So, we use our DataPoint plugin for PowerPoint, and we connect to a Microsoft Access database that we have. We see 2 tables or queries with data, and we select the table, ‘Departures from Whitehall’, and set the data refresh rate to 1 second because we consider that data changes are important to its viewers and passengers.
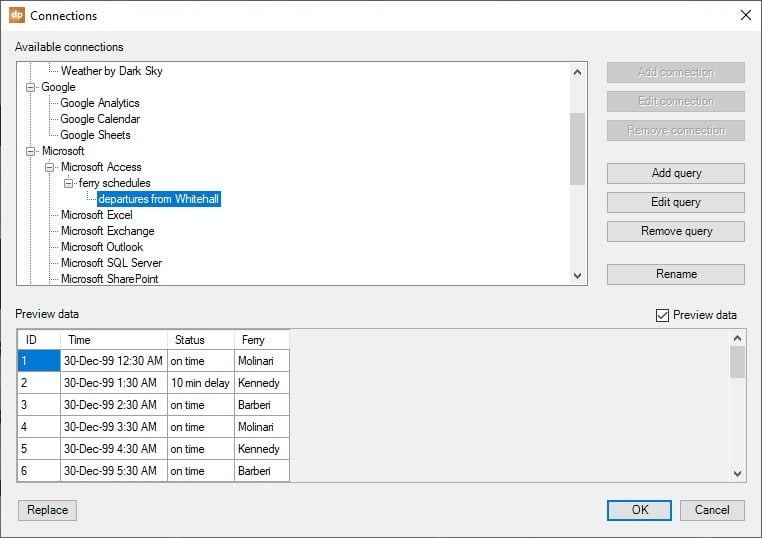
To only show current and next ferries and exclude the old ones, for that we have 2 options. We can create a query in Microsoft Access where we compare the departure time to the current date and return only the times/ferries in the future. A second option is that we link to the full data from the table here in DataPoint, and that we use a local filter in DataPoint to filter out old ferries.
Linking PowerPoint Shapes
After that, we can use a table or use multiple text boxes to show the real-time ferry data. Here we bind a text box to the departure time. We prefer to work with text boxes over tables, because text boxes have more individual options to format than tables.

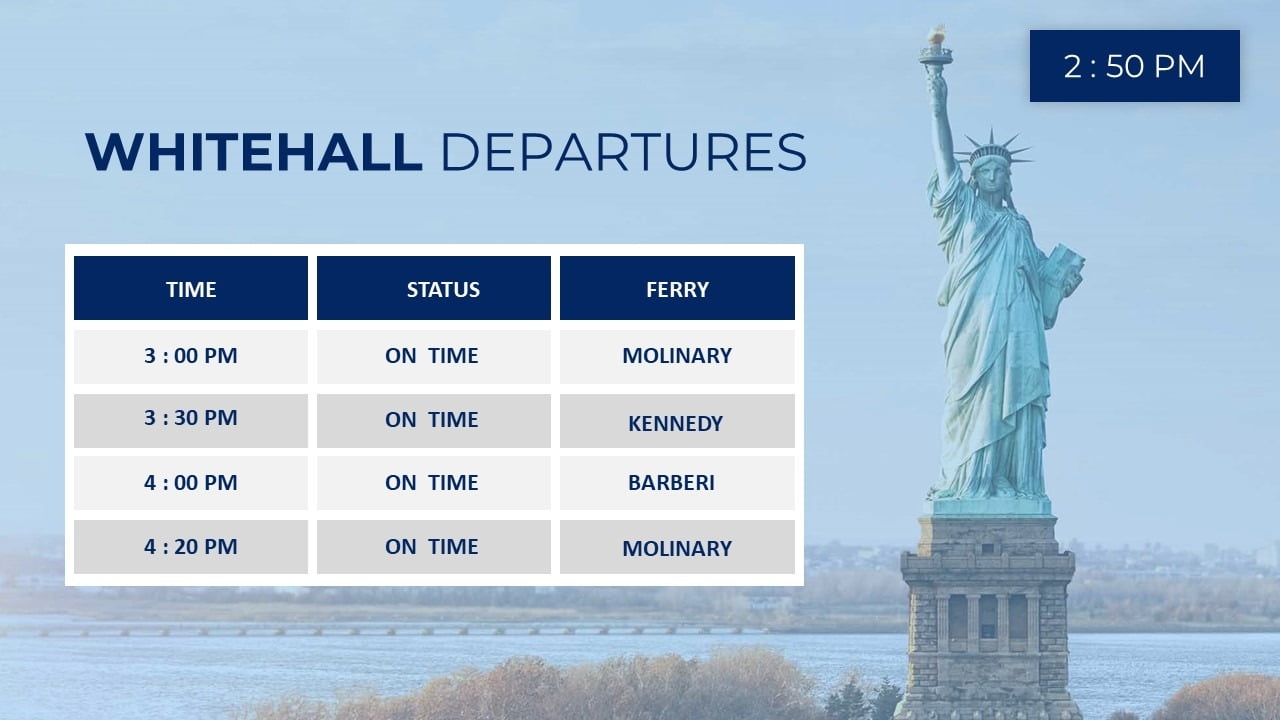
Real-time Data-Driven Slideshow
Bind all data to text boxes to automatically show the 4 next ferries and run the slideshow. Operators will update the Microsoft Access database from a network share and DataPoint will read out, and refresh the data every second on every screen.
With DataPoint they could enhance the information on the screen like e.g. messages and announcements about delays, strikes, safety measures, etc. And a weather or news widget to fill the screen.
Download a free trial of DataPoint or contact us for more info.


