
Jul 6, 2021 | DataPoint, Evergreen
Here is the recording of Kurt Dupont’s webinar, “Create Data Visualization Infographics in PowerPoint.” Questions about data visualization infographics? Contact us and we would be happy to help. Case Studies Sales Dashboard Case Study Teacher...
Jul 21, 2018 | Articles, DataPoint, DataPoint Real-time Screens
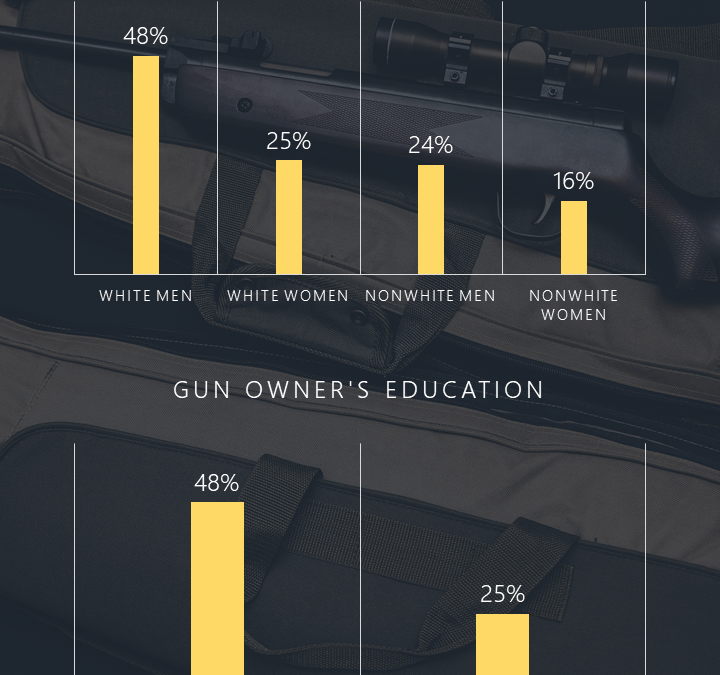
We created this gun ownership infographic to show you how you can use PowerPoint to visually show data. Click on the infographic to see it full size. What is an Infographic? “Infographics” is a shortened compound word from “information” and...
Jun 10, 2018 | Articles, DataPoint, DataPoint Automation, Marketing and Advertising
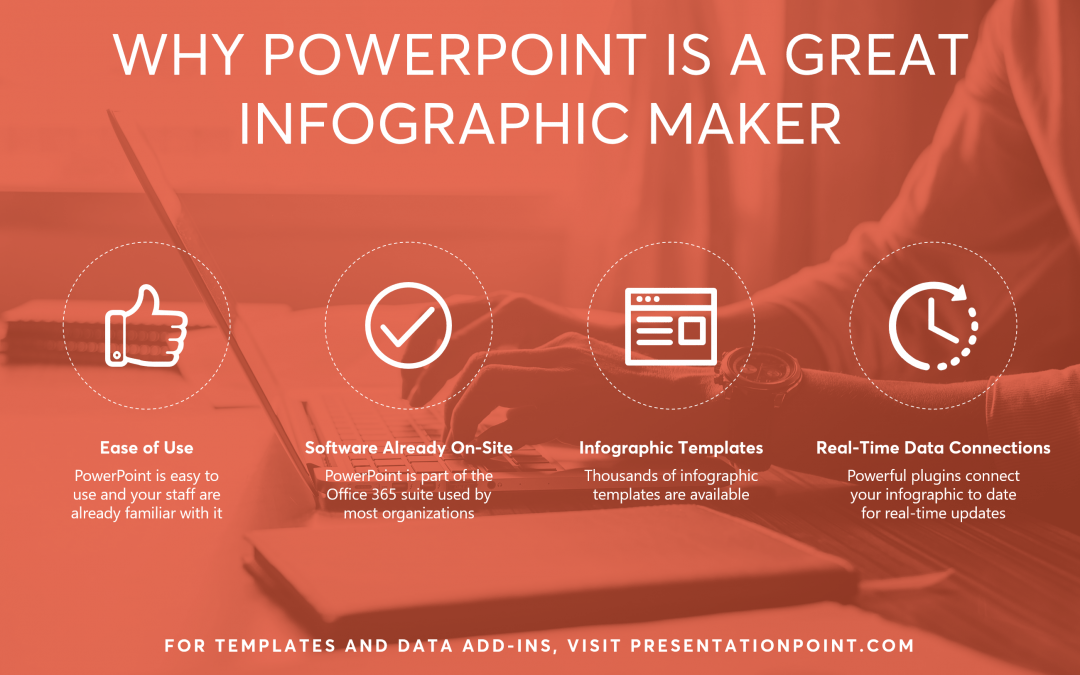
In this article, we will explore how PowerPoint can be used as an infographic maker. What is an Infographic? An infographic is a graphic, VISUAL representation of data or information you are trying to convey. It goes beyond just charts by combining the visual...
