May 21, 2015 | DataPoint, DataPoint Automation
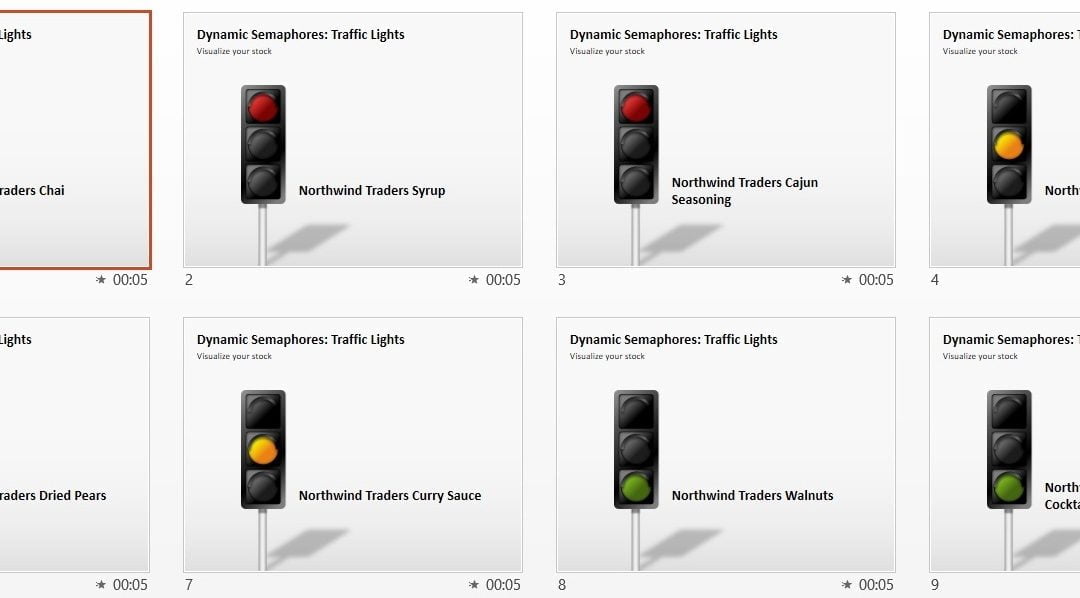
Semaphores are visual signals and are a clear and direct impression of the situation. In Excel and the database the user keeps the raw numbers but when the present data to the audience then the user don’t use that raw data at all. When a number like 82 is...
Nov 24, 2014 | DataPoint, DataPoint Automation, DataPoint Real-time Screens, How-To
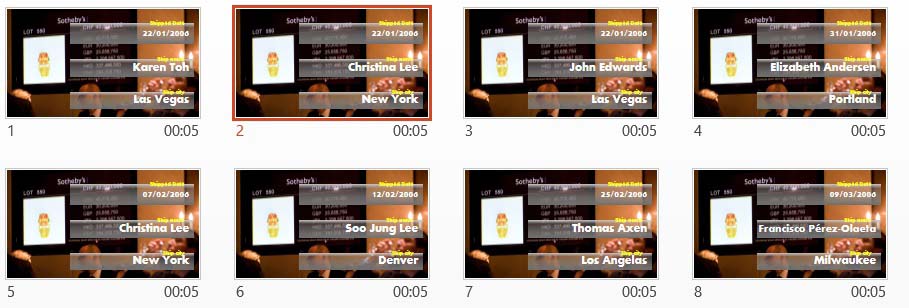
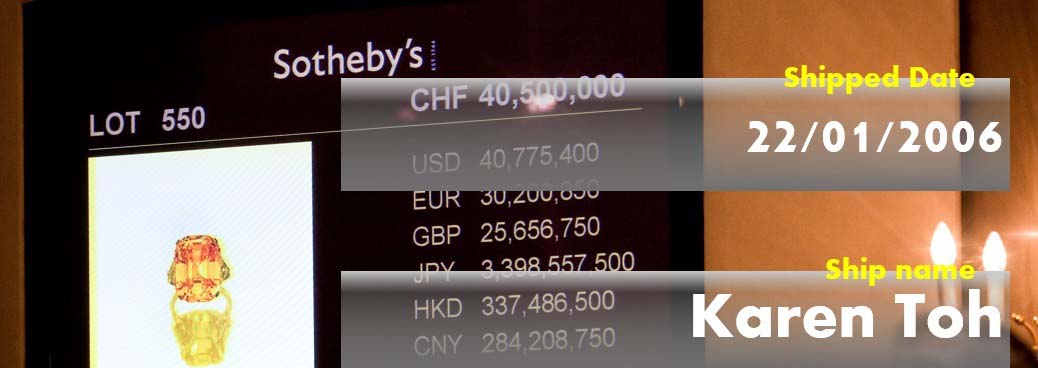
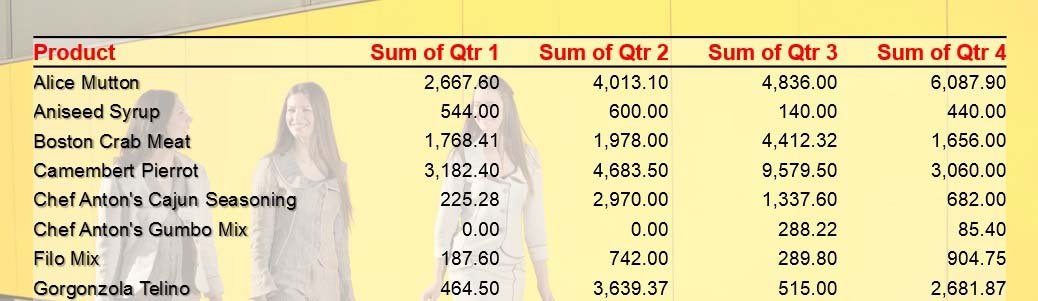
In the last article I explained how the user can connect a Microsoft PowerPoint presentation to a Microsoft Access database. The example presentation that I created was linked to the demo northwind Access database. In that article I linked and displayed order...
Nov 20, 2014 | DataPoint, DataPoint Real-time Screens, How-To
With DataPoint, the user can add new functionality to Microsoft PowerPoint for data driven presentations and update their content when the user open the presentation and while running the slide show. With PowerPoint and DataPoint combined, the user can have some kind...
Nov 17, 2014 | DataPoint, DataPoint Automation, DataPoint Real-time Screens, How-To
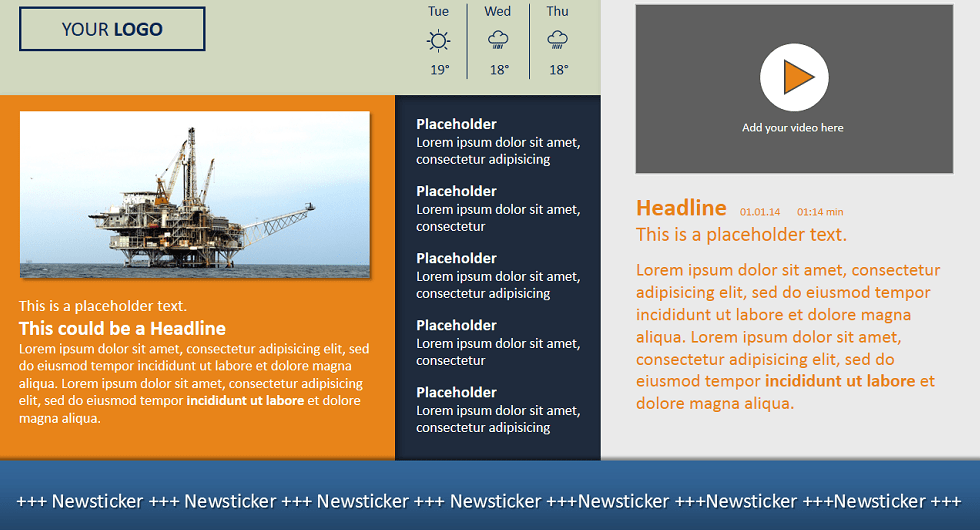
Sometimes you want to display live information in a PowerPoint presentation. Maybe you need to display scores or results in real time to people on a television screen. A manager needs to see production figures of a factory at his desk. People on the floor need to know...

Oct 14, 2014 | DataPoint, DataPoint Real-time Screens, How-To
First of all, why would you like to display database information in a presentation? Look around you! You are surrounded by data enabled presentations. Take a train station as an example. The LED screens and VGA computer screens that you see in a train station, are...