We created this gun ownership infographic to show you how you can use PowerPoint to visually show data. Click on the infographic to see it full size.
What is an Infographic?
“Infographics” is a shortened compound word from “information” and “graphics.” Infographics are visual representations of information, data or knowledge.
Putting data and information into a graphics format works with our ability to see patterns and makes data and information more accessible.
Where Did You Get the Data for the Infographic?
In this case, I accessed the data from Pew Social Trends. Pew Research is one of the world’s leading, nonpartisan sources of surveys and statistical information in the world.
Pew Research has surveys and data relating to politics, social trends, media, religion, technology, science and much more.
What Data Does This US Gun Ownership Infographic Show?
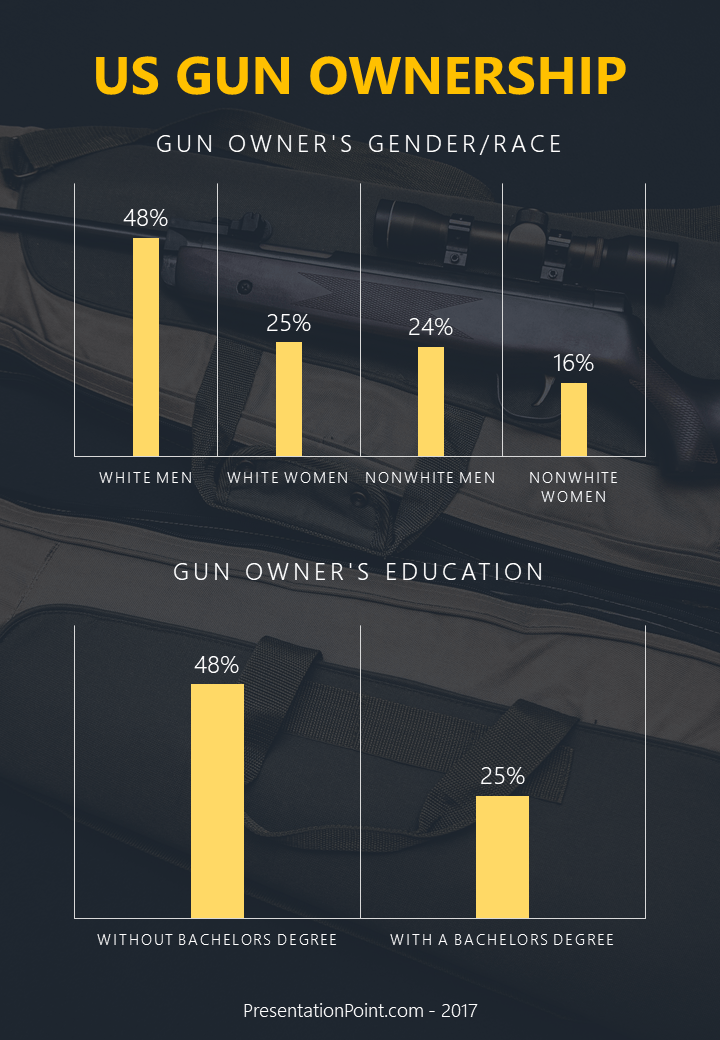
In this case, I chose my data to make a point. While there was a lot of data provided, I was checking to see how important gun ownership was to people in the US by race, gender and education levels.
When I broke the data down by race and gender, I found the following:
- White Men – 48% own a gun
- White Women – 25% own a gun
- Nonwhite Men – 24% own a gun
- Nonwhite Women – 16% own a gun
The largest US gun ownership group is white males, but even only 48% of them own a gun. White women (25%) and nonwhite men (24%) owned about the same amount of guns and nonwhite women were the smallest group with only 16% owning guns.
This data indicates to me that gun ownership is actually not something the majority of people in the US practice although it is very widespread.
The education data was also interesting. If you don’t have a Bachelor’s degree, you have a 41% probability of owning a gun. If you have a Bachelor’s degree, you are only 26% likely to own a gun. So there is a significant correlation that gun ownership is much higher among less educated people.
What if The Data Changes?
A survey like this is like a snapshot – it only shows what is happening at that moment. When the data changes, so should your infographic.
If your infographic is designed in PowerPoint ™, you can connect your infographic to real time data using DataPoint. DataPoint lets you take live data feeds from over 25 sources, including:
- RSS feeds
- text files
- spreadsheets
- XML files
- news
- weather
- Google Calendar
- JSON
- oData
- Microsoft Shrepoint
- OLE DB
- ODBC
The values and meters on your infographic can change based on the data feeds.
What Do I Use To Create My Own Infographics?
We recommend PowerPoint ™ for infographics for these reasons:
- Accessibility: Most organizations already have access to PowerPoint as part of the Office 365 suite.
- Ease of Use: PowerPoint is easier to use than other higher end graphics programs and most people in offices already know how to use it.
- PowerPoint Templates: There are a ton of PowerPoint templates available to get you started.
- Data Capable: With our DataPoint PowerPoint add-on, PowerPoint can show data in real time.
Don’t want to do the graphics yourself? We offer custom PowerPoint design services as well.
Need help with PowerPoint, infographics and data? Contact us and we would be happy to help.