I use DataPoint to display real-time information from a database during an event. When there is a value 30 in the database, then I want to display 30 icons at different locations on the screen. Sort of a visual representation of a number while updating in real-time.
That is a challenge indeed. You can use DataPoint to display a number in real-time for a PowerPoint text box, but translating the physical number in a number of pictures or icons, need some more handling. But not a problem at all. Let me demonstrate.
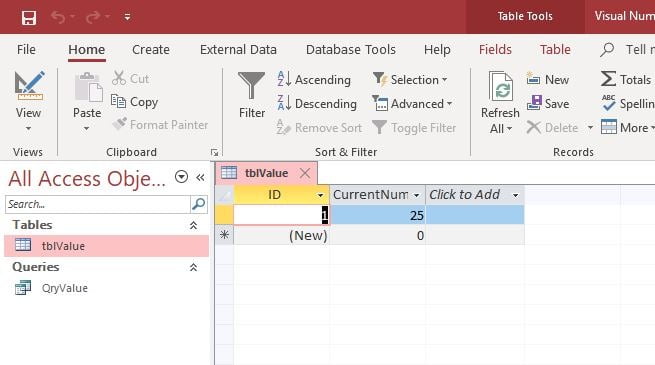
For this we will use a basic Microsoft Access database to store and change the running number. Create a table named tblValue and enter e.g. value 25 at the CurrentValue column. Don’t worry if you are not experienced with Microsoft Access as all the files are available for download at the bottom of this article.
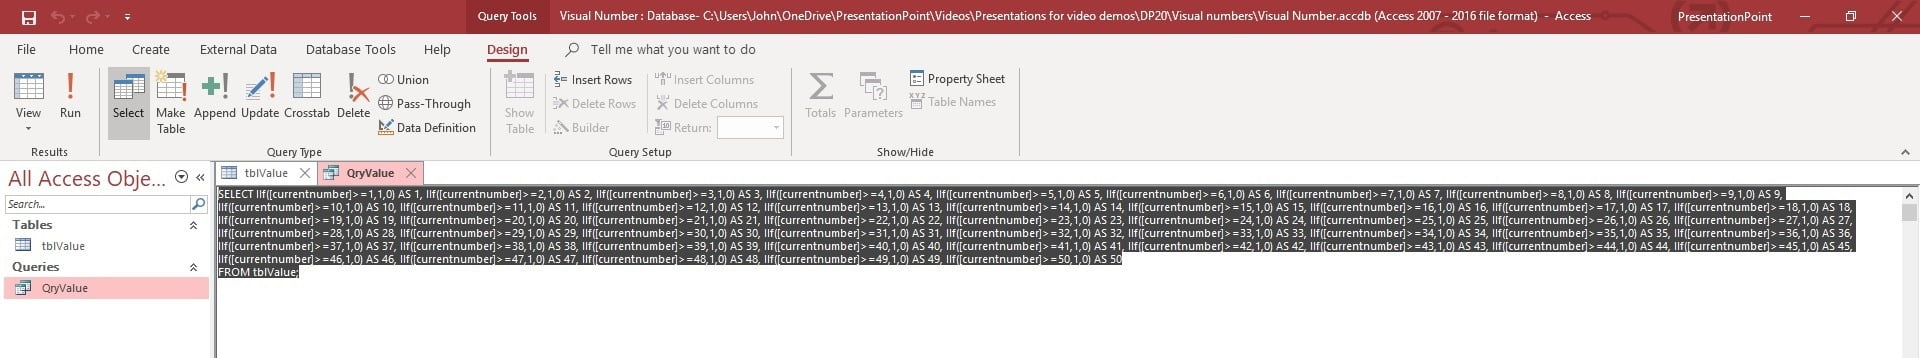
Next step is to create a query where we evaluate the current value of the table to 50 bits or switches. A bit holds value 0 or 1, false or true, off or on. We need to set up 50 columns of calculations so that we can assign every bit to a picture later on on the slide. This is the SQL we use here:
SELECT IIf([currentnumber]>=1,1,0) AS 1, IIf([currentnumber]>=2,1,0) AS 2, IIf([currentnumber]>=3,1,0) AS 3, IIf([currentnumber]>=4,1,0) AS 4, IIf([currentnumber]>=5,1,0) AS 5, IIf([currentnumber]>=6,1,0) AS 6, IIf([currentnumber]>=7,1,0) AS 7, IIf([currentnumber]>=8,1,0) AS 8, IIf([currentnumber]>=9,1,0) AS 9, IIf([currentnumber]>=10,1,0) AS 10, IIf([currentnumber]>=11,1,0) AS 11, IIf([currentnumber]>=12,1,0) AS 12, IIf([currentnumber]>=13,1,0) AS 13, IIf([currentnumber]>=14,1,0) AS 14, IIf([currentnumber]>=15,1,0) AS 15, IIf([currentnumber]>=16,1,0) AS 16, IIf([currentnumber]>=17,1,0) AS 17, IIf([currentnumber]>=18,1,0) AS 18, IIf([currentnumber]>=19,1,0) AS 19, IIf([currentnumber]>=20,1,0) AS 20, IIf([currentnumber]>=21,1,0) AS 21, IIf([currentnumber]>=22,1,0) AS 22, IIf([currentnumber]>=23,1,0) AS 23, IIf([currentnumber]>=24,1,0) AS 24, IIf([currentnumber]>=25,1,0) AS 25, IIf([currentnumber]>=26,1,0) AS 26, IIf([currentnumber]>=27,1,0) AS 27, IIf([currentnumber]>=28,1,0) AS 28, IIf([currentnumber]>=29,1,0) AS 29, IIf([currentnumber]>=30,1,0) AS 30, IIf([currentnumber]>=31,1,0) AS 31, IIf([currentnumber]>=32,1,0) AS 32, IIf([currentnumber]>=33,1,0) AS 33, IIf([currentnumber]>=34,1,0) AS 34, IIf([currentnumber]>=35,1,0) AS 35, IIf([currentnumber]>=36,1,0) AS 36, IIf([currentnumber]>=37,1,0) AS 37, IIf([currentnumber]>=38,1,0) AS 38, IIf([currentnumber]>=39,1,0) AS 39, IIf([currentnumber]>=40,1,0) AS 40, IIf([currentnumber]>=41,1,0) AS 41, IIf([currentnumber]>=42,1,0) AS 42, IIf([currentnumber]>=43,1,0) AS 43, IIf([currentnumber]>=44,1,0) AS 44, IIf([currentnumber]>=45,1,0) AS 45, IIf([currentnumber]>=46,1,0) AS 46, IIf([currentnumber]>=47,1,0) AS 47, IIf([currentnumber]>=48,1,0) AS 48, IIf([currentnumber]>=49,1,0) AS 49, IIf([currentnumber]>=50,1,0) AS 50
FROM tblValue;
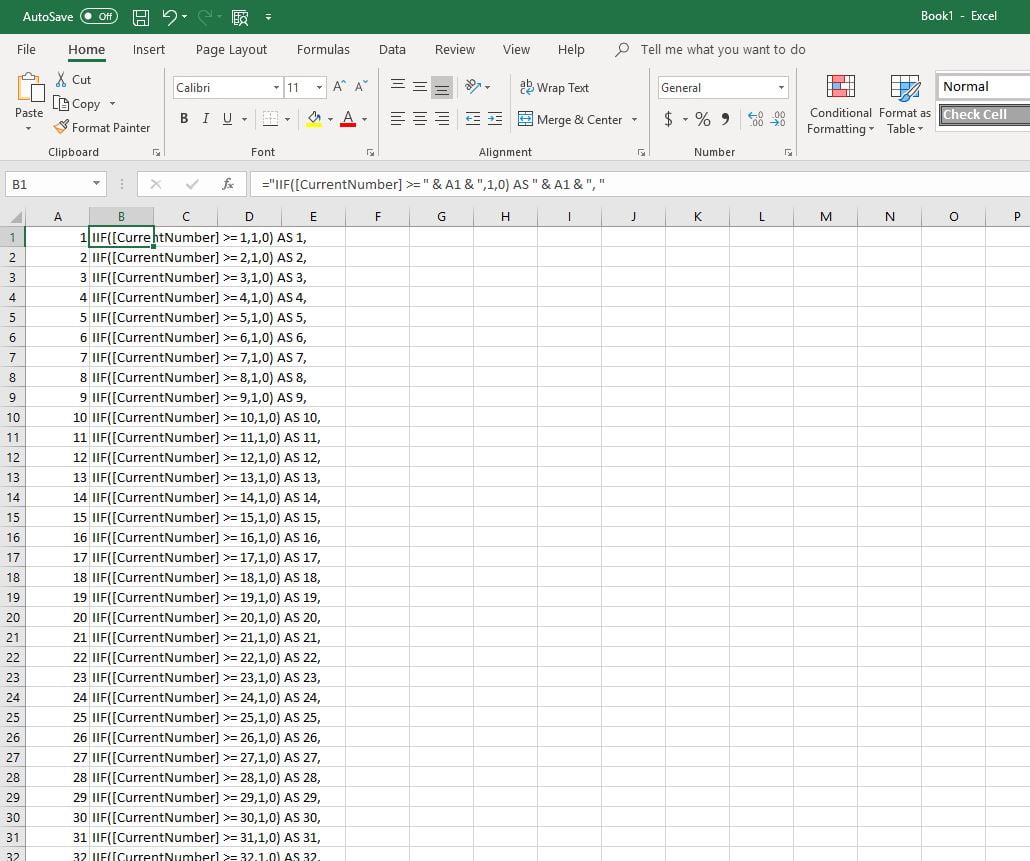
A complex statement you might think. True but we did not type it in manually. We used a trick.
In an Excel worksheet, type in value 1 at cell A1. Then at cell A2 use the formula:
=A1+1
Then copy down the formula of cell A2 to A50 so that we have 50 values.
Then at cell B1 type the following formula:
=IIF([CurrentNumber] >= 1,1,0) AS 1,
And copy this down till cell B50.
Now select all cells of the B column and press CTRL-C to copy the info. Go to your query and use CTRL-V to paste the list of 50 calculations. Piece of cake.
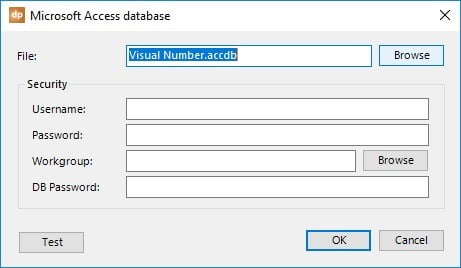
Open the DataPoint menu of the PowerPoint ribbon and click the List button of the Connections group. Navigate to Microsoft and select the Microsoft Access data provider. Now click Add connection. Navigate and select the database that we created earlier. Use a full path pointing to your database file, or use the filename only when you have the database and presentation located in the same folder.
After setting the database, click the Add query button and select the QryValue query. For fast updates while the slideshow is running, set the data refresh rate to 1 second.
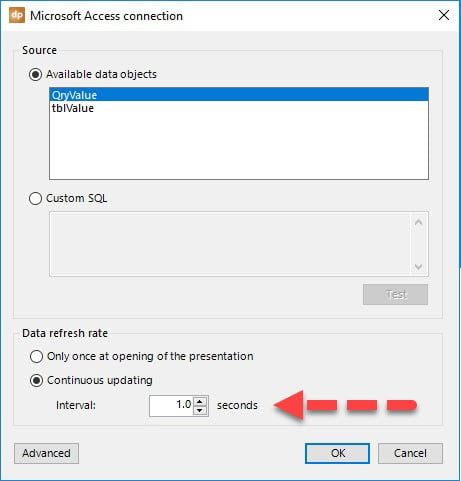
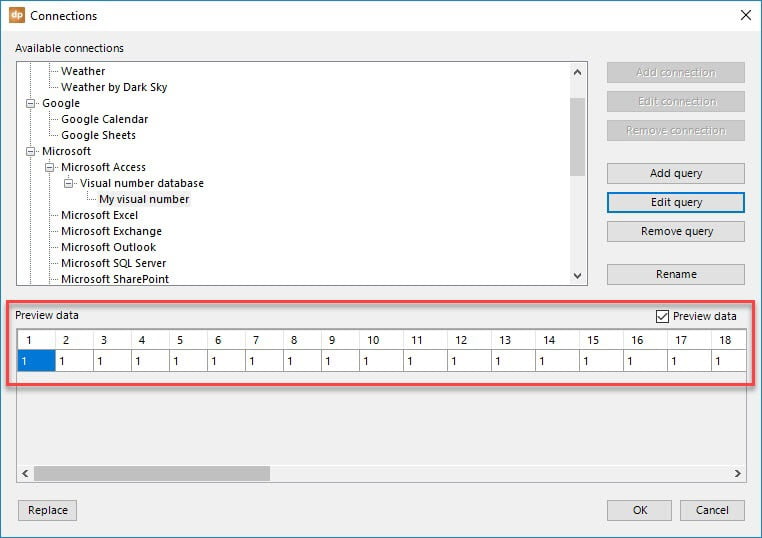
Click OK to close and you will see a preview of the current data.
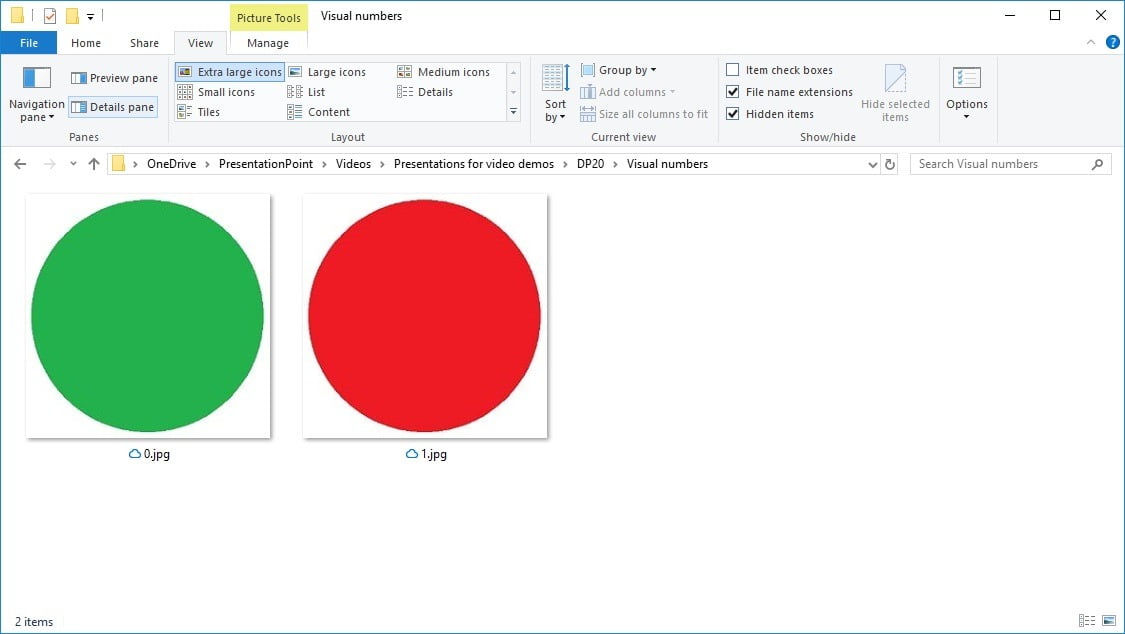
Remember that our database query was calculating a value 0 or 1 for us. At the same folder of the presentation, we will have 2 images named 0.jpg and 1.jpg. We will dynamically bind the value of the query columns to 50 icons on our slide, and use one of the 2 pictures here. Of course, you can use any type of image for this.
Click Insert, Picture from the PowerPoint ribbon and insert any picture to your slide. Select this inserted picture and click the Picture button of the DataPoint ribbon.
Set the column to column name 1 of our query.
Indicate that the data of the selected column contains the filename only. Leave the folder option empty because we have the images and the presentation in the same folder (you can always specify the folder if you want) and set the extension to jpg.
Click OK to close and now this picture is dynamically linked to the value of column 1 of our query.
Duplicate this first picture and align it next to the first one. Click the Picture button again and set it to link to column name 2.
A quicker way is to select the duplicated picture and use the +C button (next column) from the DataPoint shortcuts at the DataPoint ribbon.
Duplicate your picture or icon so that you have 50 linked pictures on your slide.
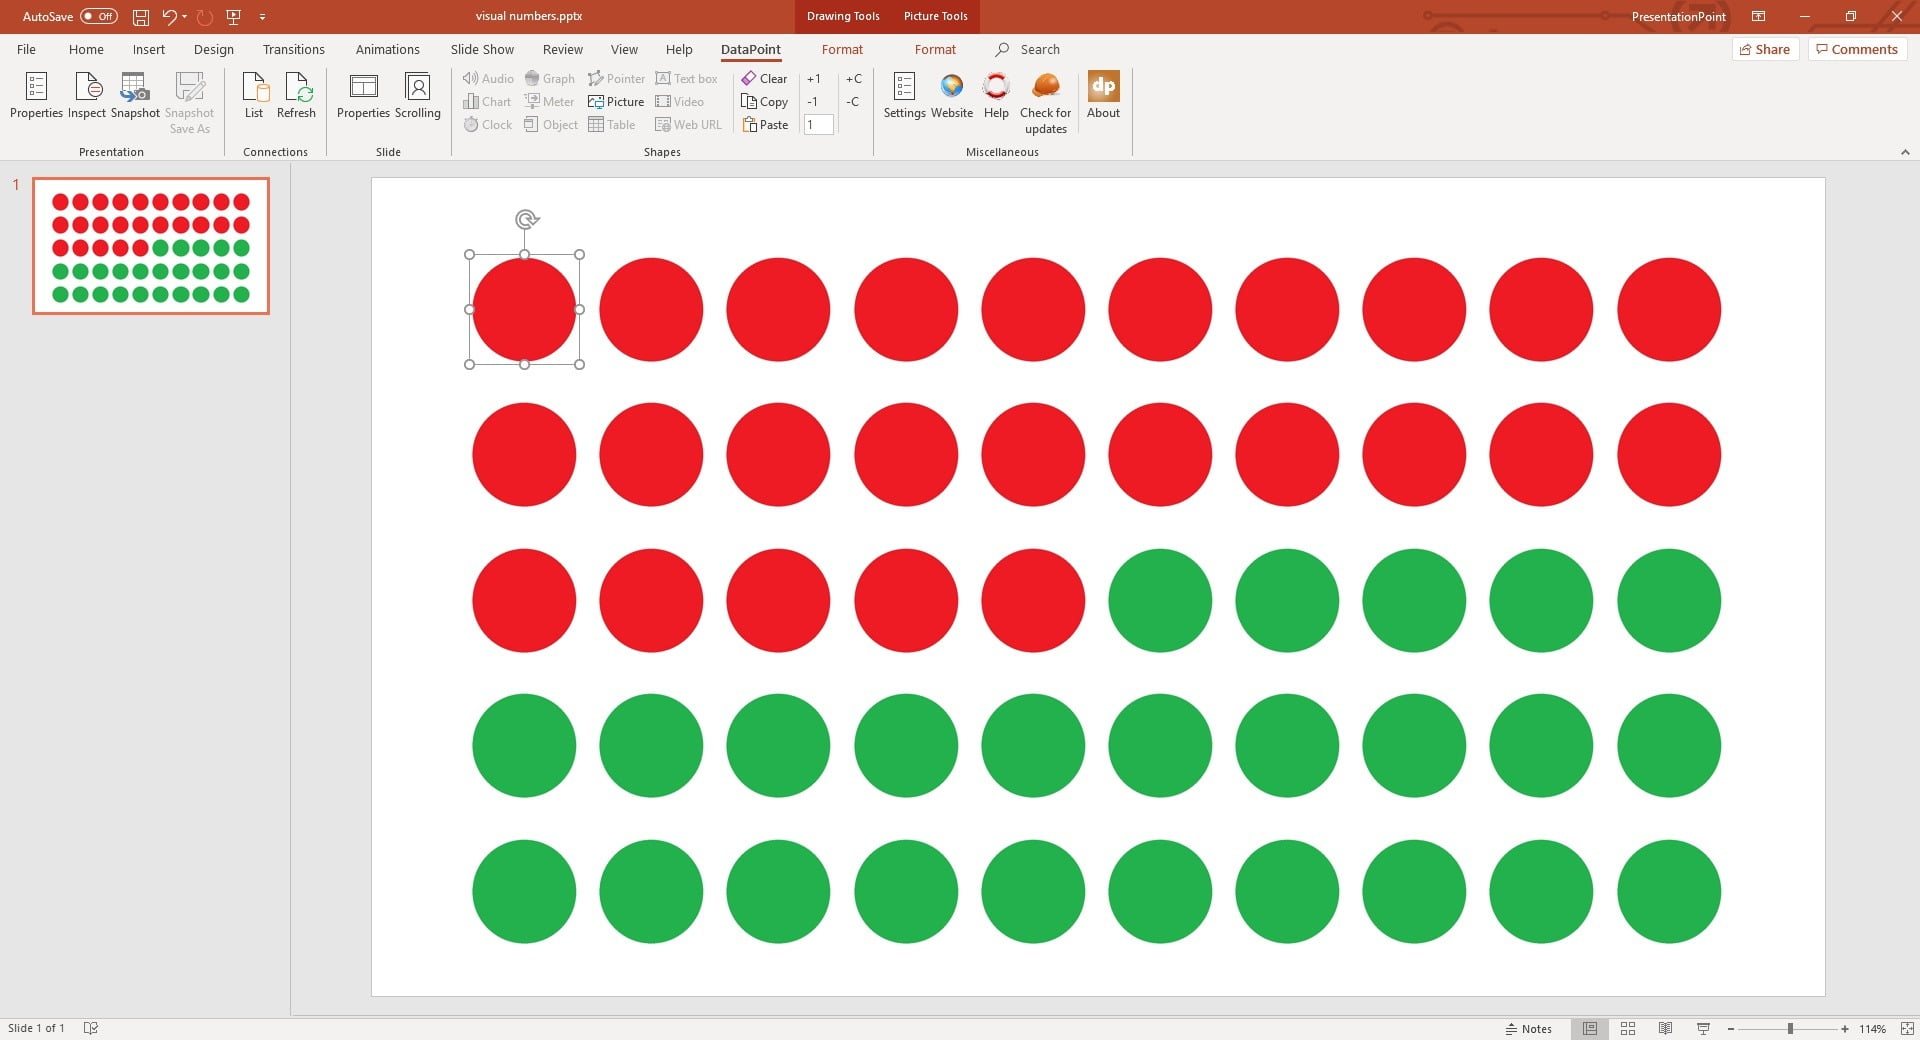
Set the slide show type to kiosk so that it runs forever and displays full-screen. Now you can open your database on a second computer to update the value and have the icons change dynamically.
You can download a ZIP file with all files and materials of this article.