
Why are Truck Logistics Important?
Truck logistics dashboards answer many questions for you by providing an at-a-glance screen where you can see all your key indicators.
- Where are my trucks?
- Where are my people?
- Where is my equipment?
- What trucks, people, and equipment do I have available in an area?
Why Not Just My App Dashboard?
You might already be using apps or programs to manage your truck logistics. So why can’t you just use one of these apps or programs as your dashboard?
Usually, you have multiple programs to track things like where trucks are, who is driving, how many hours have they driven, fuel consumption, maintenance, etc. Using DataPoint, you can pull data from all these multiple sources. And, since DataPoint works with PowerPoint, you have more graphic control over output.
Step 1: Gathering Data
Check to see what data sources you already have available. These might include:
- GPS fleet tracking
- Dispatch software
- Smartphone trucking apps
- Maintenance records
- Driving records
- Fuel usage
Truck Location Dashboard – GPS
If you have real-time GPS tracking for your fleet, you can use our software to show the real-time location of each unit on a map.
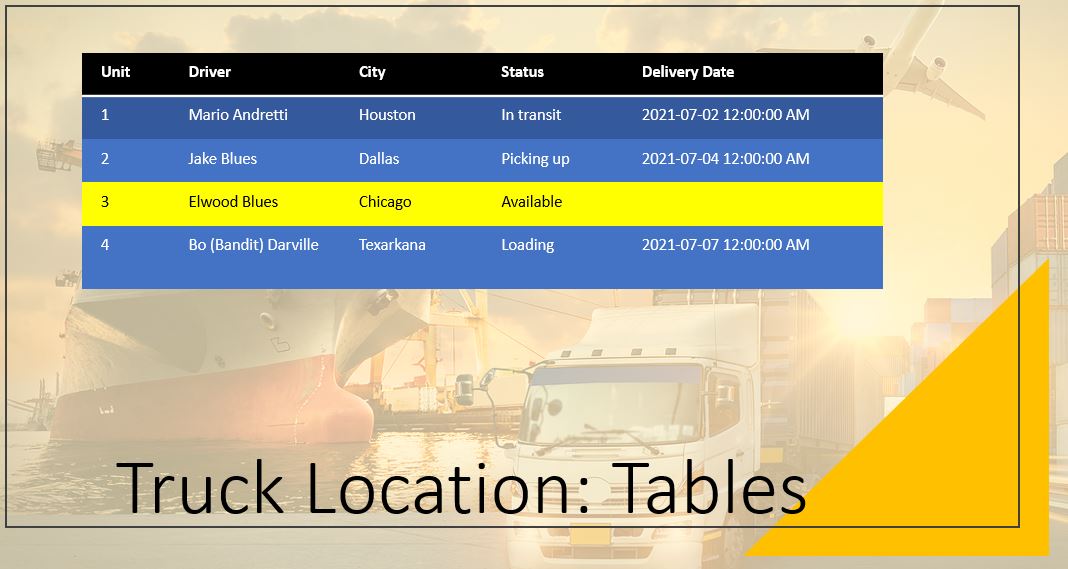
Truck Location: Tables
Alternatively, you can show the location of each unit using PowerPoint tables. This table was connected by inserting a standard PowerPoint table, then using DataPoint to connect the table to the data sources in real-time. Watch the video above to see how this was done.
Beyond Truck Locations – Other KPIs
You can track much more than truck locations on your truck logistics dashboard. Here are some other key performance indicators you can track.
- On-time pickup/delivery
- Cost per pound
- Cost per mile
- Equipment utilization
- Fuel pricing & consumption
- Safety metrics
- Shipping error rates
- Sustainability metrics
- Maintenance costs
- Driver turnover rate
- Employee satisfaction
- Customer satisfaction
Create Your Own Logistics Dashboard
Want to create your own logistics dashboard? Download the free trial of DataPoint and get started today. As always, contact us with any questions or help you need.

