
When you are in New York and you want to run away from the city, from the noise and traffic, you go to Coney Island in Brooklyn. Take the orange D or F, or yellow N or Q train; all 4 lines will take you directly to Coney Island, New York’s most famous amusement park with attractions like the Luna Park, the Cyclone or Deno’s Wonder Wheel Amusement Park.
Another must-see attraction is Nathan’s Famous, a company that runs a chain of fast food restaurants specializing in hot dogs, with its most famous location at Coney Island. You can’t miss it when you exit the train station.

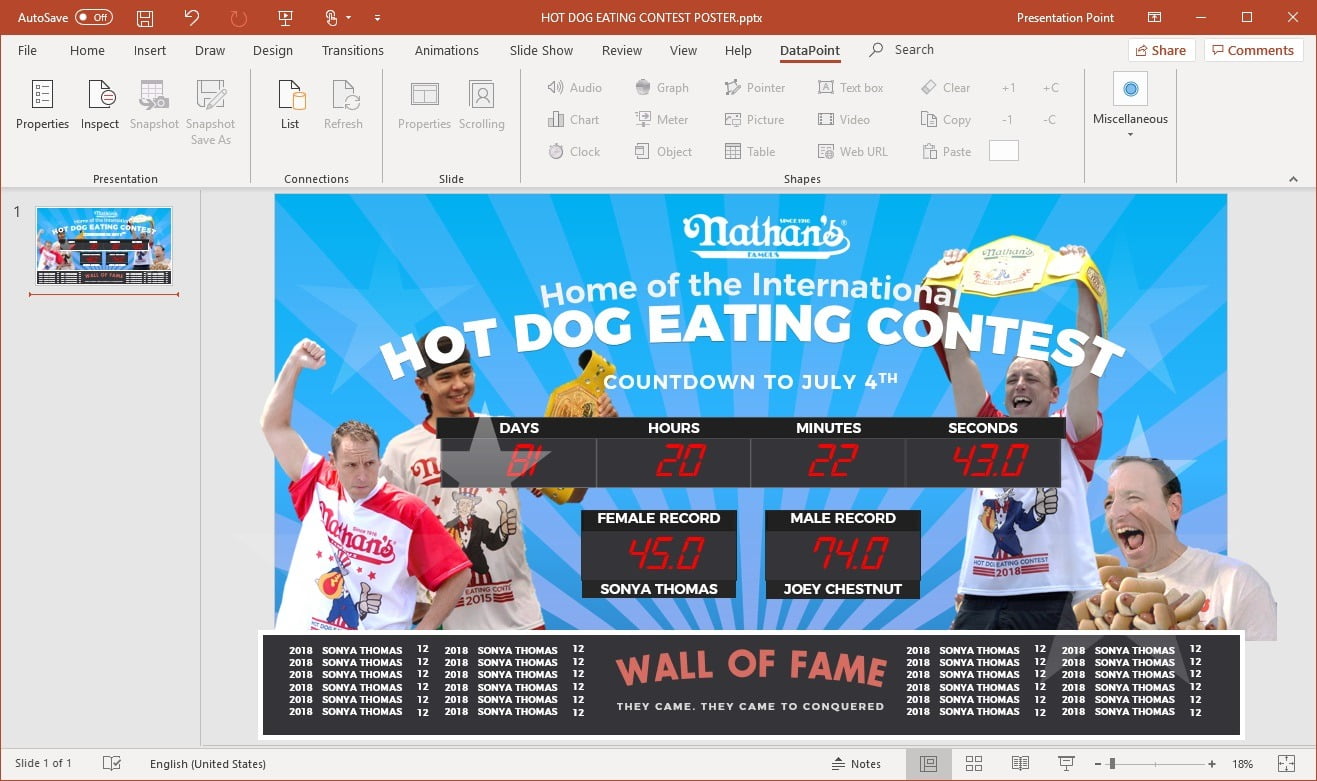
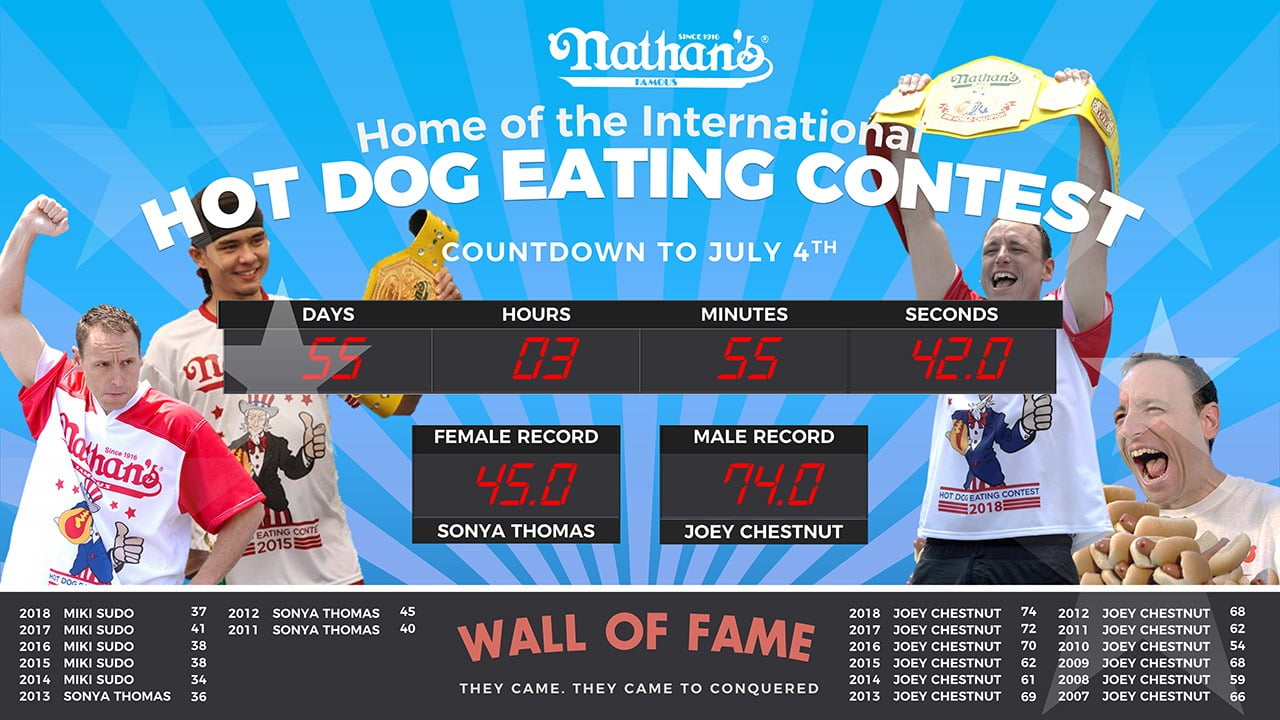
Every year at the 4th of July they organize a hot dog eating contest where the participants have to eat as many hot dogs as possible in 10 minutes time. You can see a large scoreboard at Coney Island where you can currently see that Sonya Thomas holds the female record (45 hot dogs) and Joey Chestnut holds the male record (74 hot dogs).
Their scoreboard clearly displays these records on large LCDs. They also count down till the next hot dog eating contest, the next 4th of July. In our makeover section, we are always looking for opportunities where we can change something in a data-driven PowerPoint presentation.

We recreated their scoreboard as a PowerPoint presentation. Not bad, right? But PowerPoint is static. You can’t update the content of a PowerPoint presentation when the slideshow is running. But there is a trick: use the DataPoint plugin for PowerPoint!
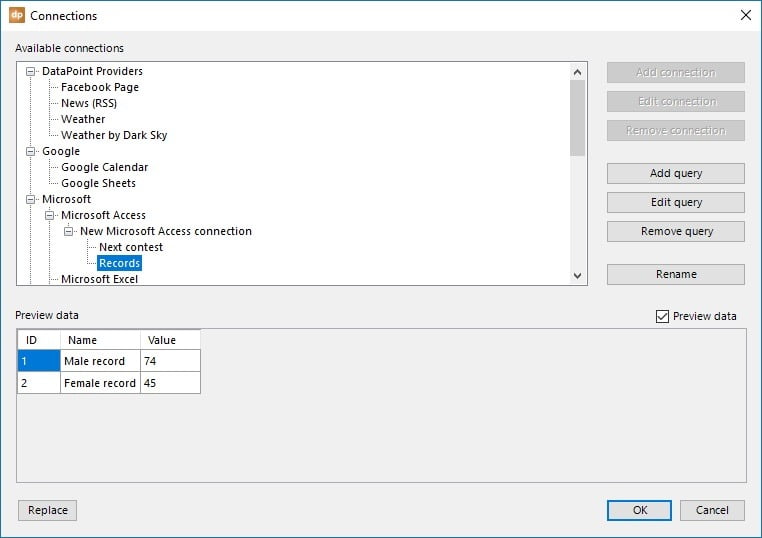
On this slide we need to add a count down till the next 4th of July and we need to display 2 important numbers; the male and the female record. We use a Microsoft Access database for this. In this small database we can do the calculation for the countdown, and in here we can store the records as well, and update them when a new record is hit.
The Microsoft Access database where we connect to has a few tables and queries. One table to store the 2 records (male and female) and another table where we put in the target or countdown date (next 4th of July).
A query based on the countdown table is dynamically calculating the number of days, hours, minutes and seconds. A preview of the data can be seen in DataPoint.
We can use normal PowerPoint text boxes and link it to a given database column. Here we link it to the column named Seconds of the Next contest query. And we will format it properly. This text box will now always show the numeric value that was returned from the database.
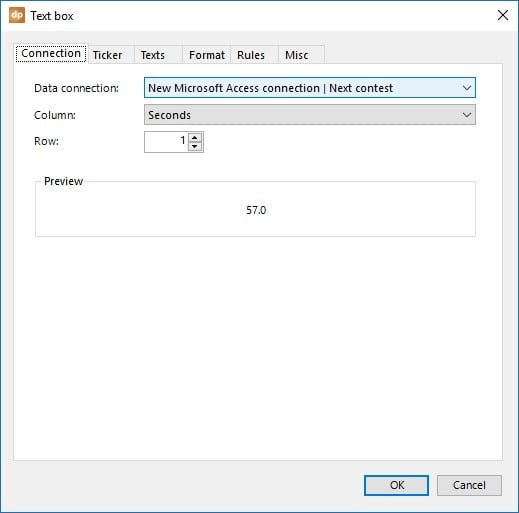
All text boxes are linked to their corresponding columns: days, hours, minutes and seconds. And below that, we are displaying the female and male records.
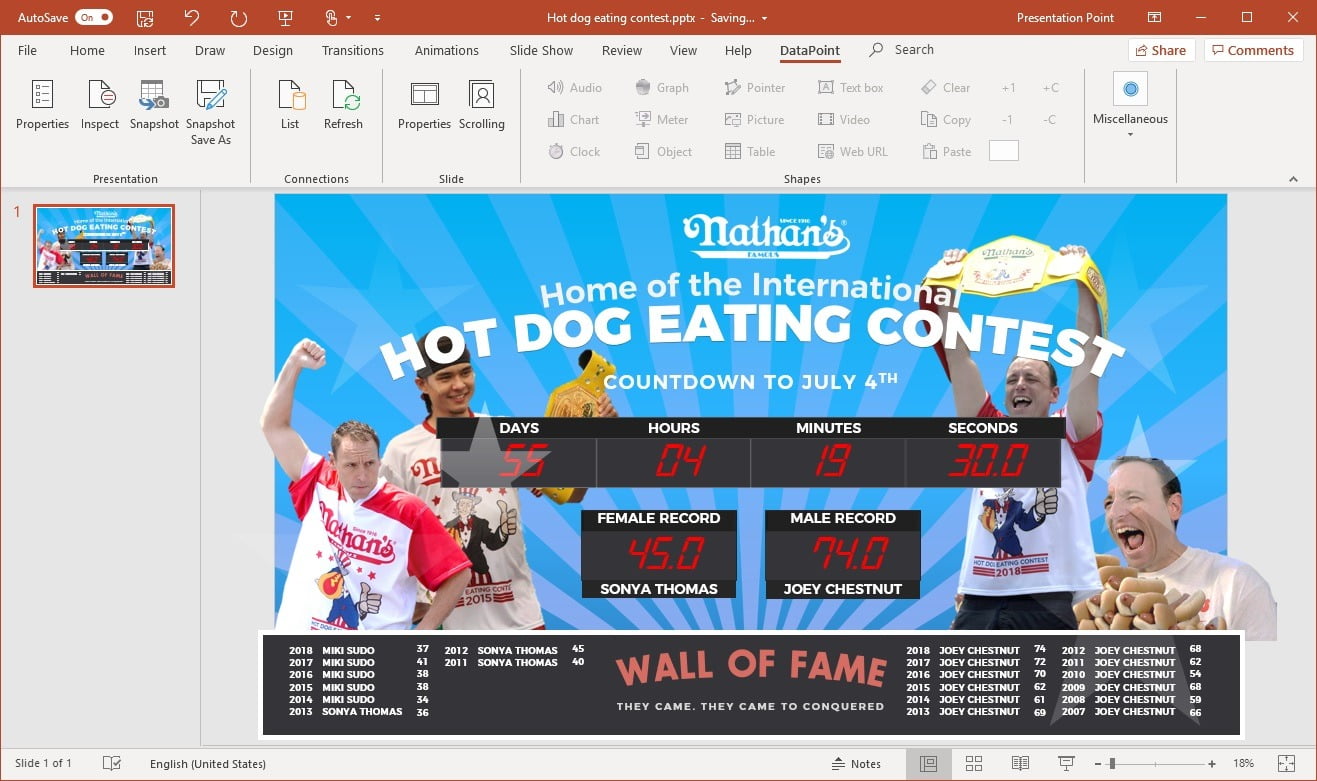
Set the slideshow type to kiosk so that it runs forever and shows full screen. DataPoint will make sure that all numbers are updated in the text boxes while the slide show is running. Whenever you have to change the records or change to the next contest date, just open the database from a second computer and make your changes. DataPoint will follow and always show the latest information.


I’m referring the big board that takes place on the 4th of July. Is there going to be one?
We are not organizing that event, so we cannot confirm Paul.