

We all know the places where you have such information screens displaying a list. Look at flight information at an airport, departing trains at a station, job listings, movies in a cinema, exhibitions etc. They are all look similar. At the first row you will find some titles or a header and then a list of data that is structured identically, row after row.
This can be build very easily with DataPoint. Basically there are 2 options to construct a page like this.
- Insert a table with some 4 or 5 columns and some 20 rows. Use DataPoint to assign a data connection directly to this table.
- Add 4 or 5 text boxes, after each other, and link them individually to each column of your first data row. Then duplicate these 4 or 5 text boxes to the next lines, and increment the linked row number each time.
Tables are great to get something done quickly. Text boxes are a bit more work, but offer more flexibility and freedom on layout and design.
Linked Tables in PowerPoint
There is a great new addition to tables in our DataPoint add-on, where you can show multiple tables on a slide in your PowerPoint presentation, but now your tables are linked together. The first table will display information of a given connection, and all the data rows that cannot be displayed in the first table is moved to the second table and so on. So basically, you get a chain of tables based on the same data connection.
You will often see this type of information when you display your list of data on a monitor in landscape orientation. Let’s work out an example to illustrate this new linked tables feature.
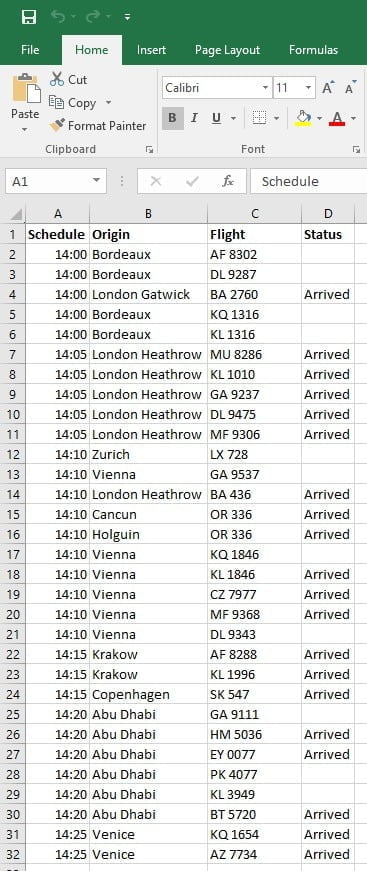
We start with our raw data. We have some flight arrivals and departures of an airport. We stored the information in 2 separate datasheets of an Excel file. This would work fine for a small airport. Medium and large sized airports better use a database system for this data.
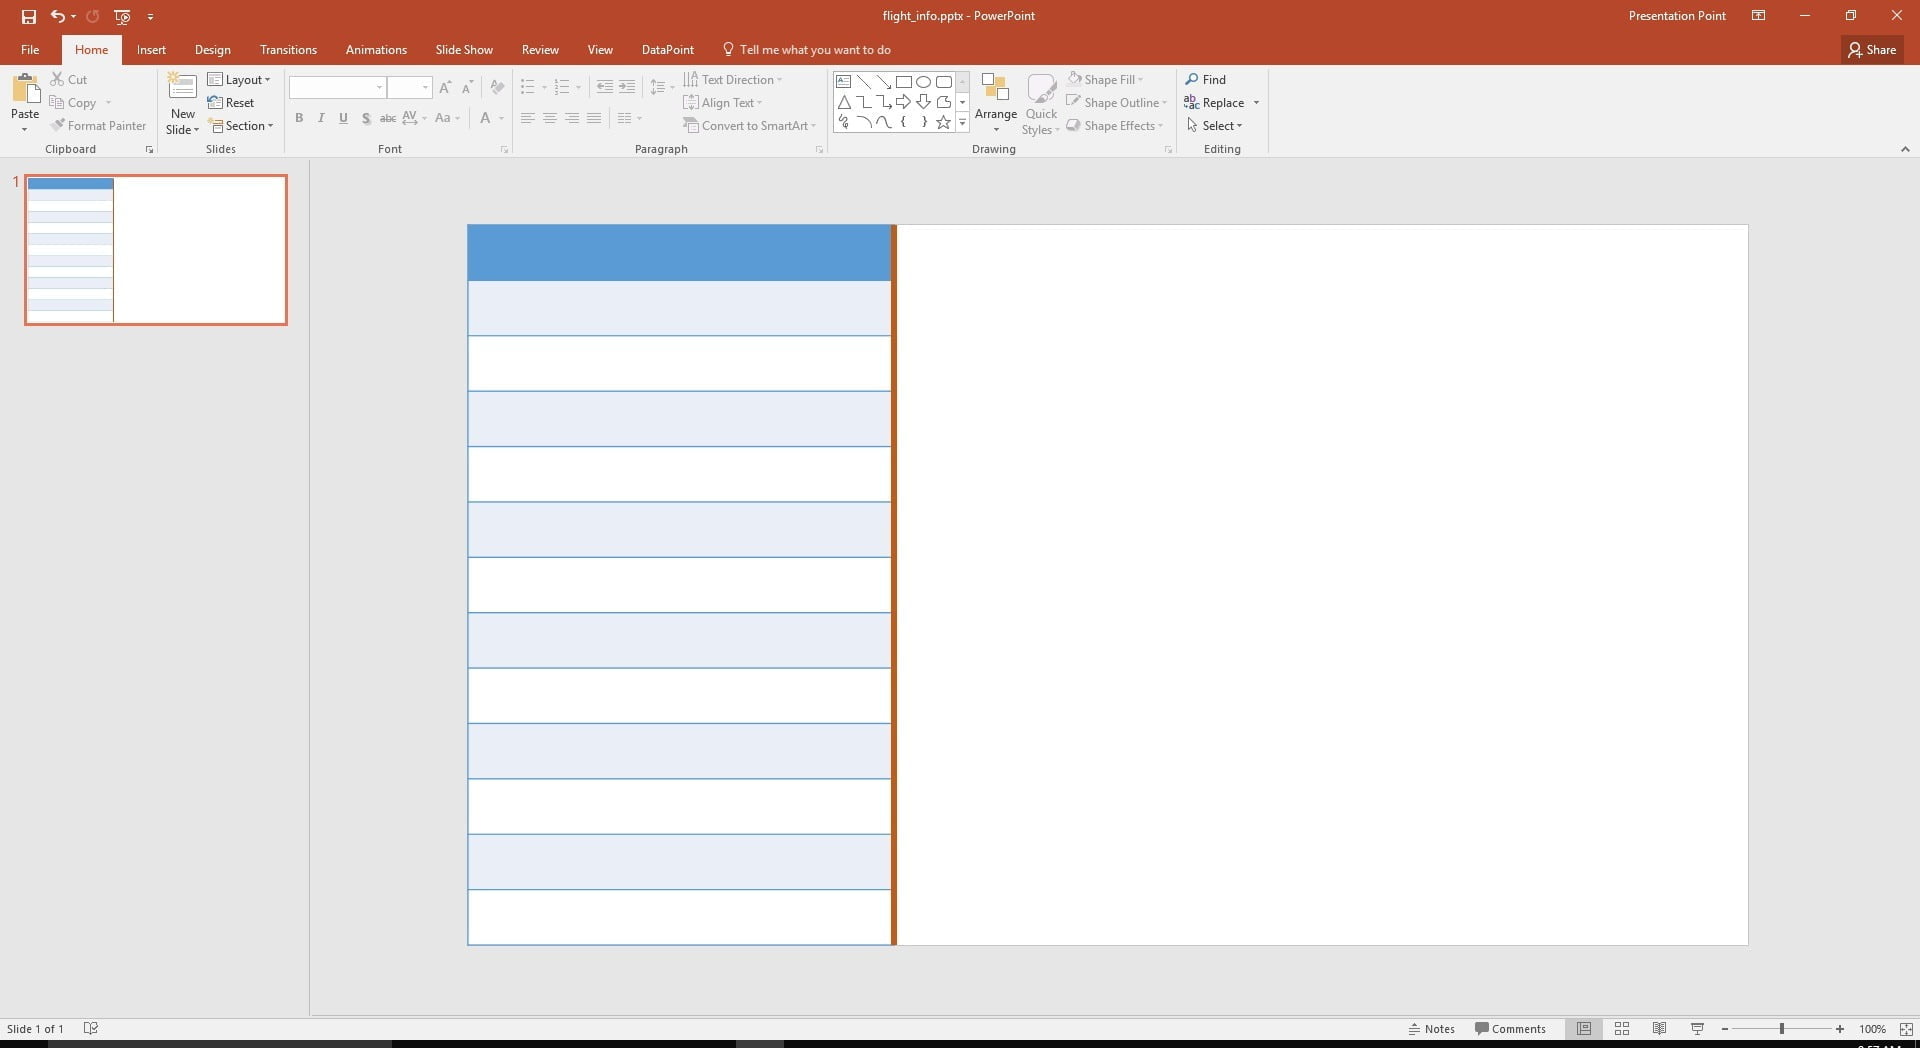
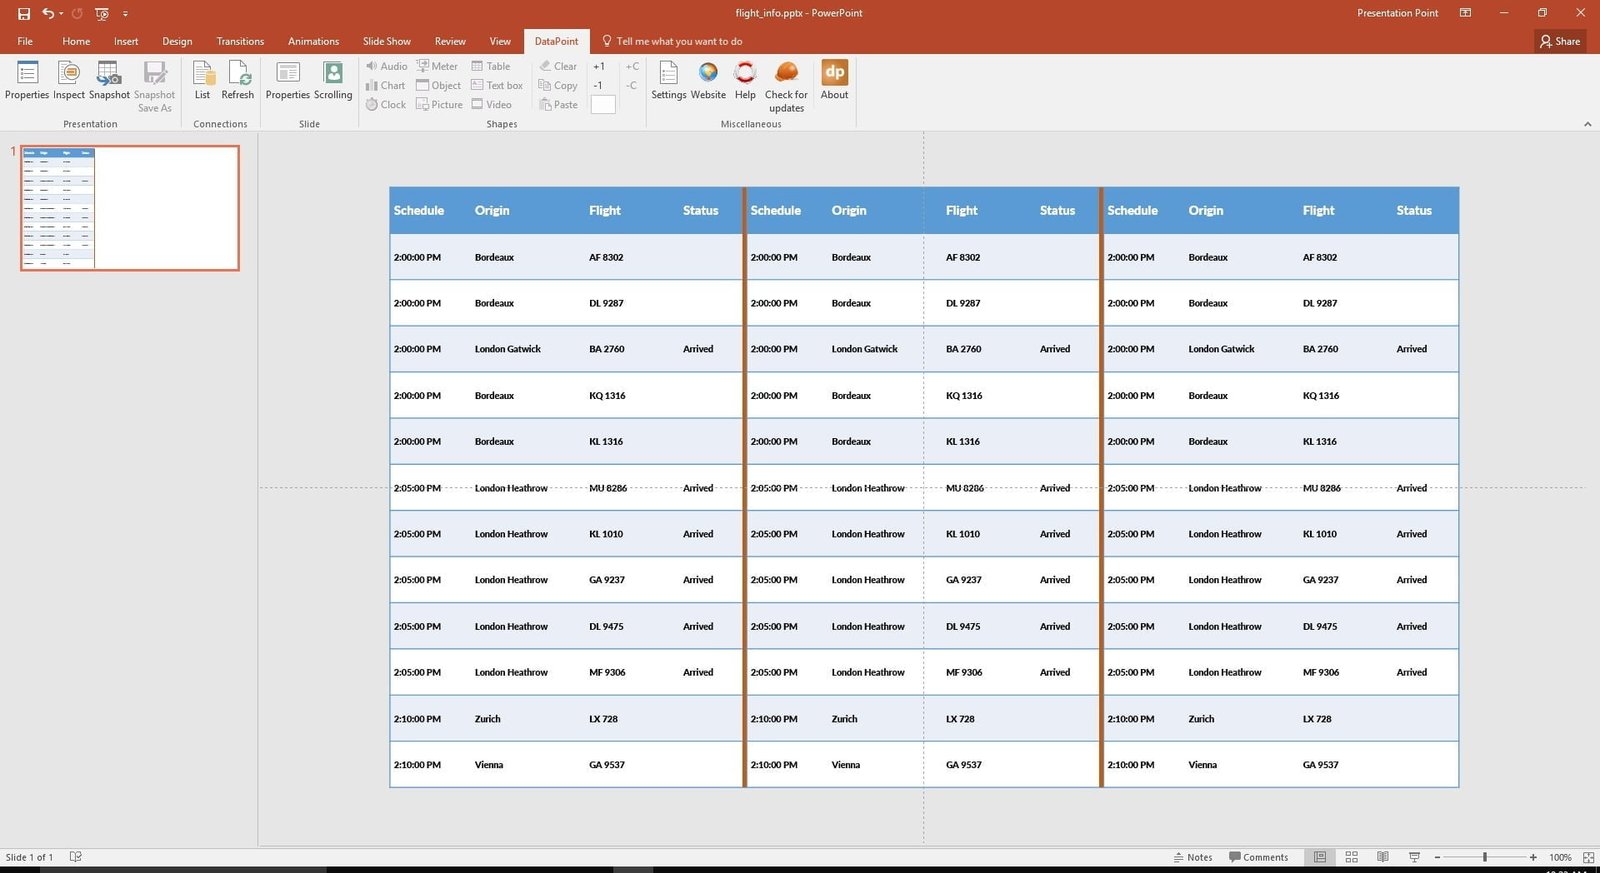
First, add a new table on the slide to host the data. Then, add a normal new table to my slide with 4 columns and 13 rows. The first row will show the header info and the other 12 rows will host the data.
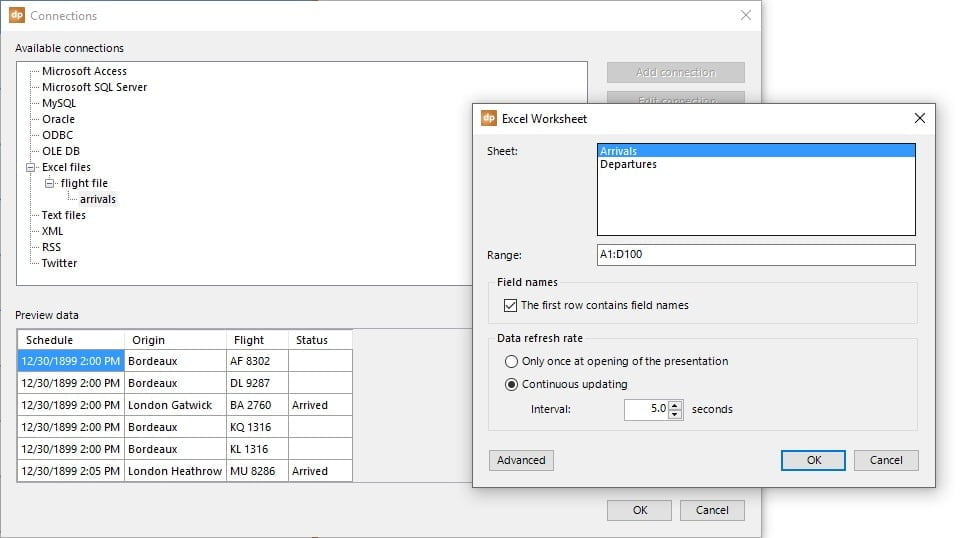
In DataPoint, set up a data connection pointing to the Microsoft Excel flight information. Use the Arrivals sheet, set an import range and set it to check for data updates, every 5 seconds.
Select the table and click DataPoint and then Table from the Shapes group.

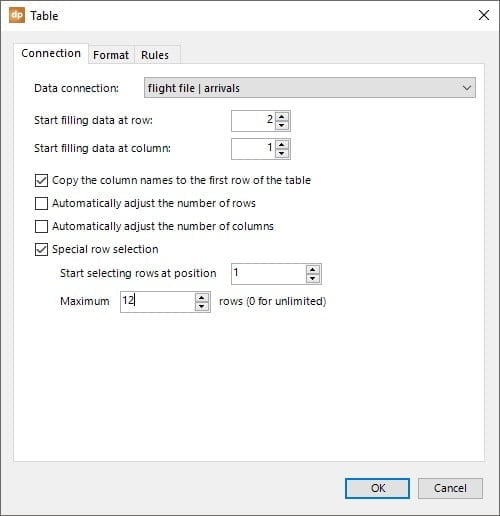
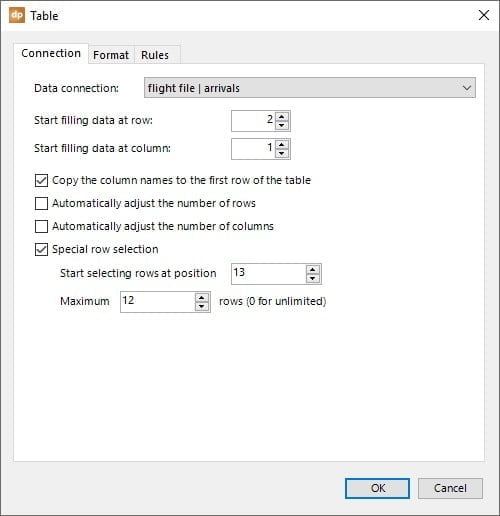
Choose arrivals flight information as the data connection. If you want to copy the header information of the connection to the first row; check the option Copy the column names to the first row of the database. By doing this, the option Start filling data at row, jumps to 2 automatically.
Then, check the option Special row selection. Set the start position to 1 and use 12 rows maximum.
The option Start selecting rows at position, indicates the first row of the complete data connection. DataPoint will position itself on row number 1 and then copy in 12 data rows into this table. Basically, these settings on the first table are not really needed. A normal linked table would already start with the first row and display the first 12 data rows.
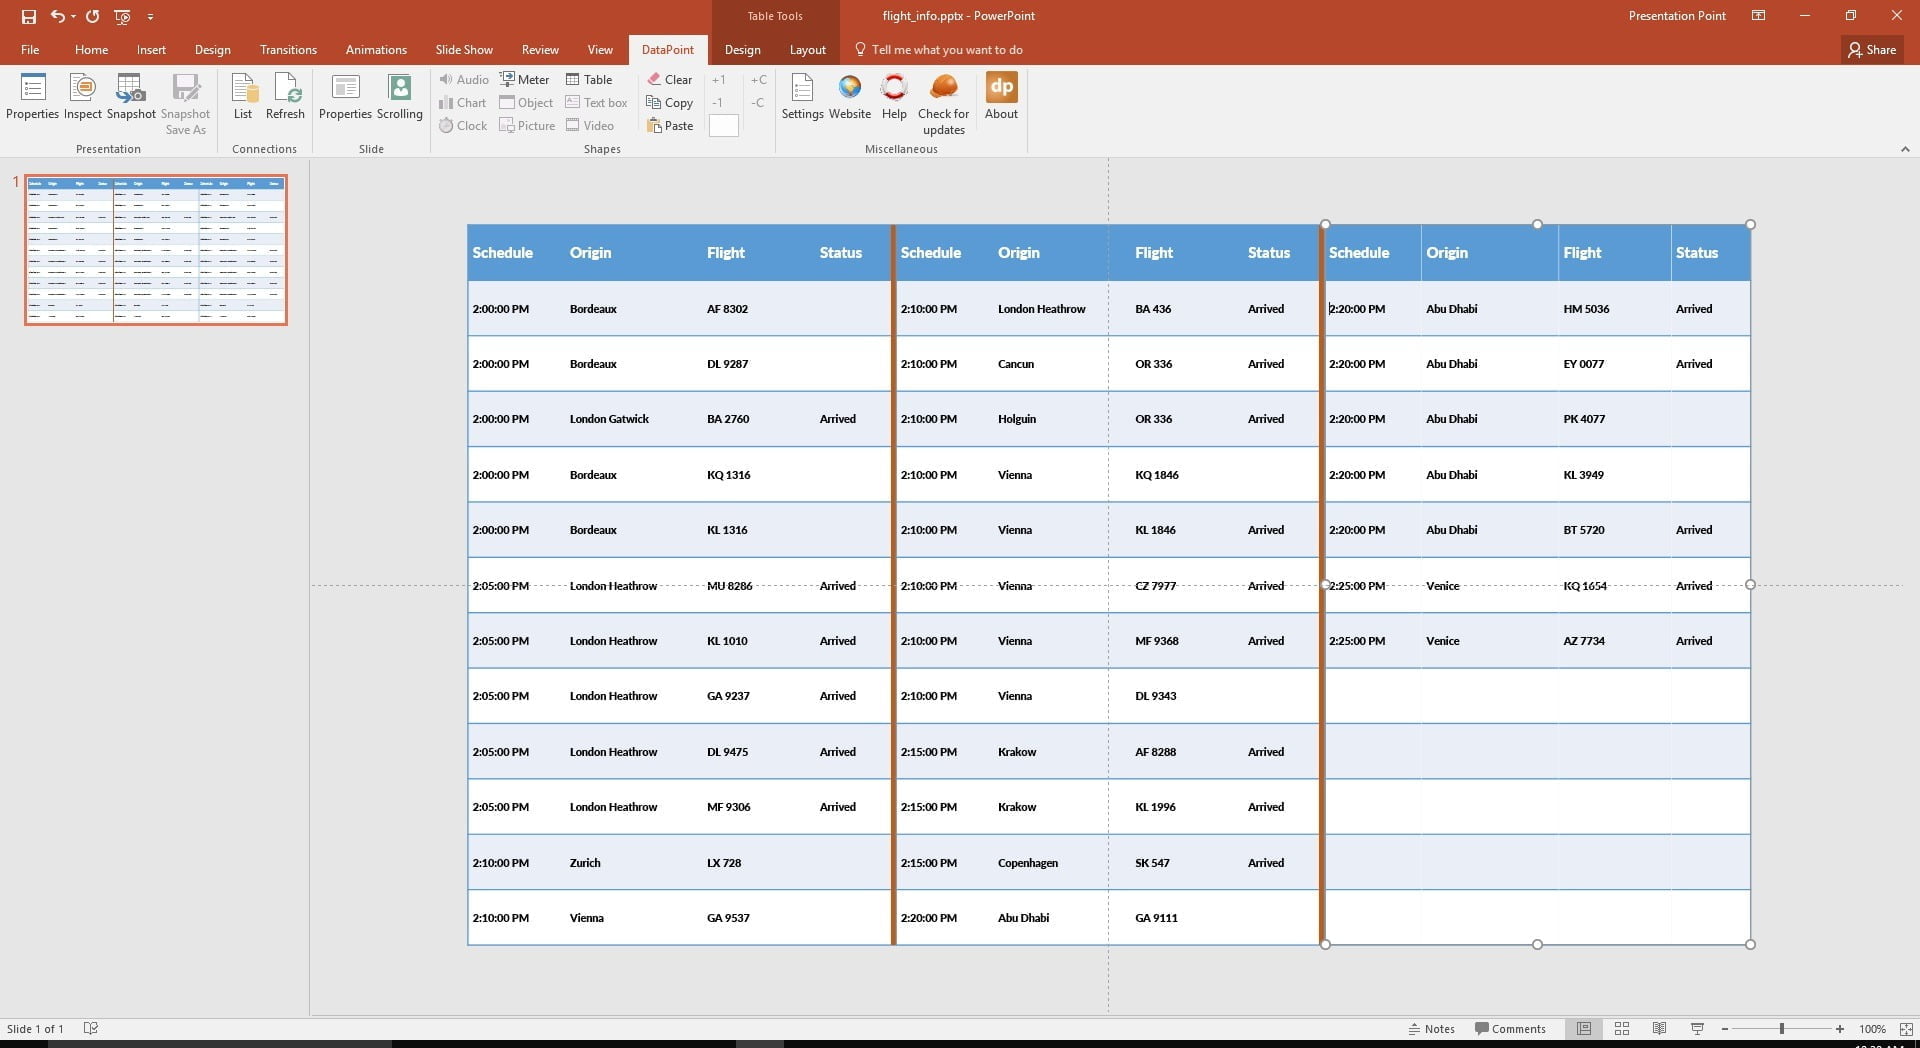
Duplicate the first table 2 times, to fill the slide like this.
Select the second table and open its DataPoint table properties. Change the Start selecting rows at position to 13 in order to continue our data flow. This table will host the data rows, starting at position 13 and then the 12 next rows. Or rows 13 to 24.
And the same for the third table. Choose to start at row number 25, in order to show the information of rows 25 to 36.

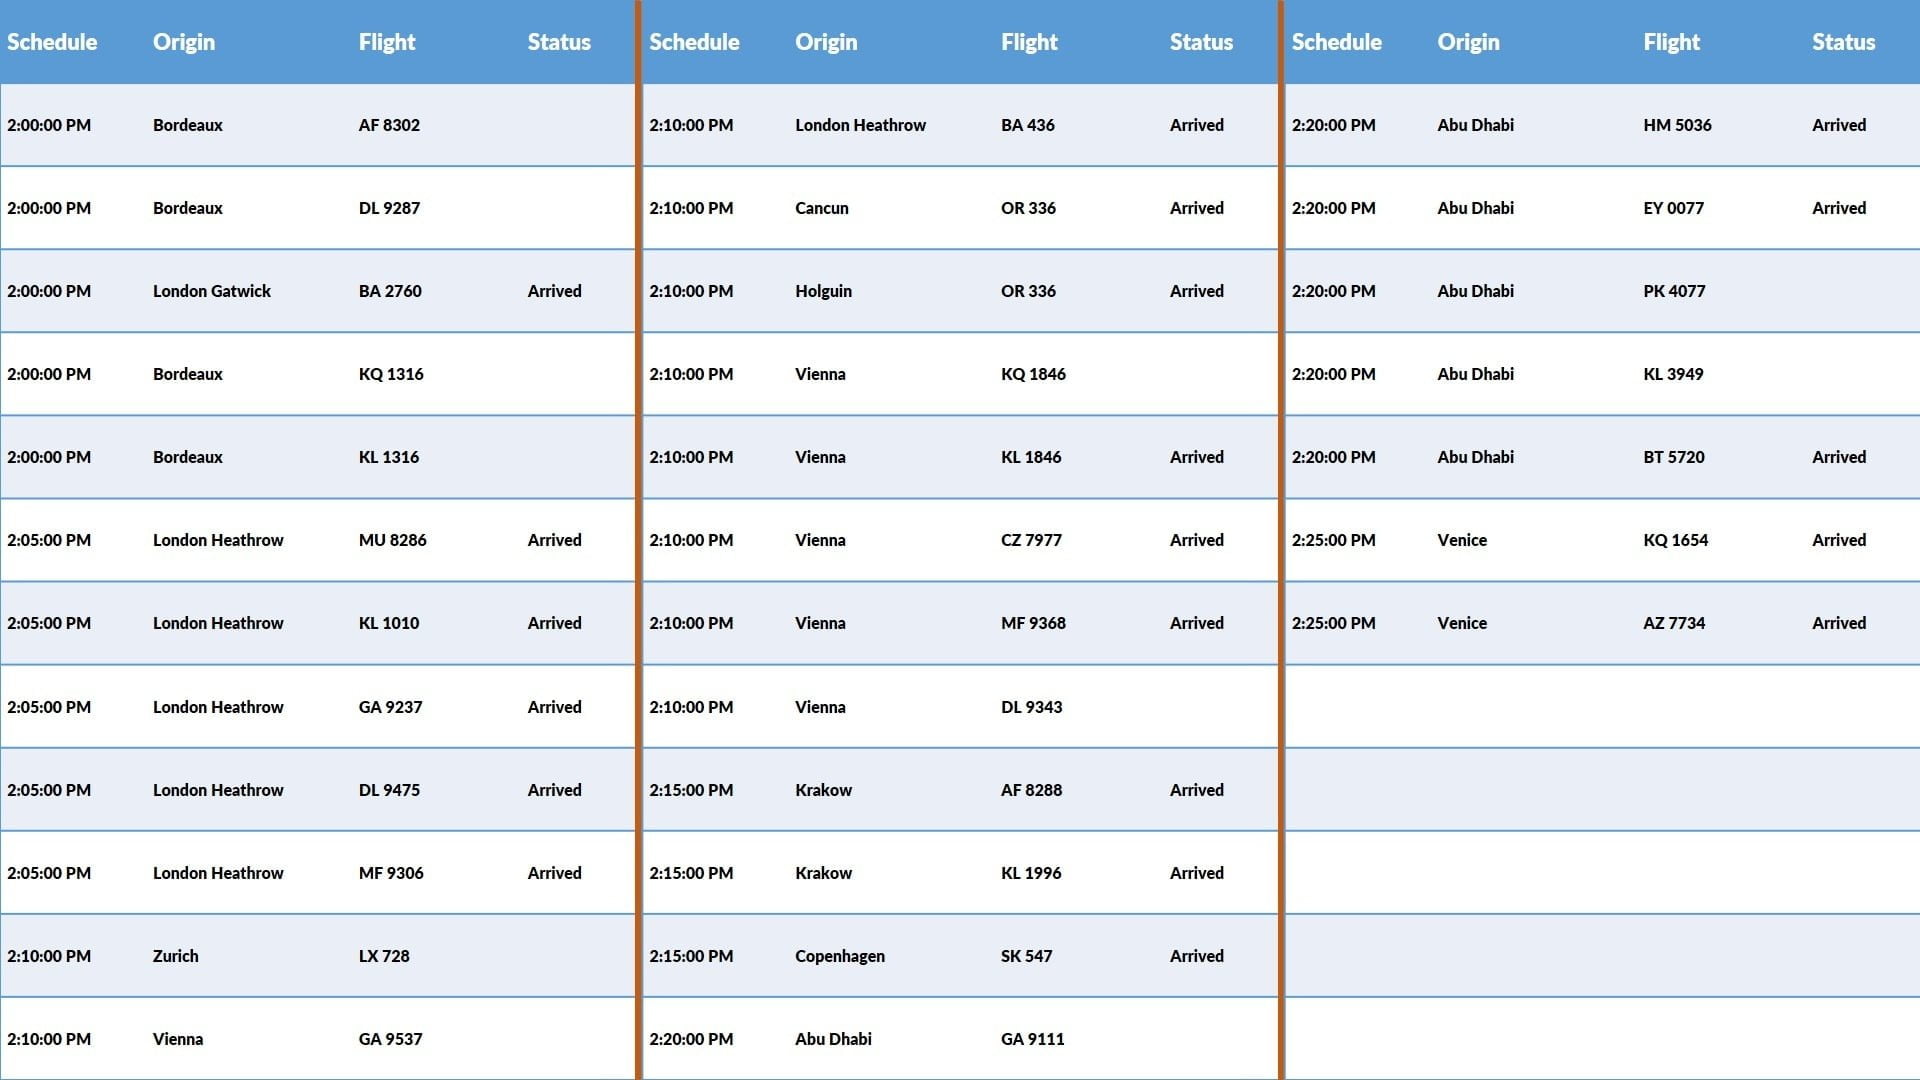
When you look at the slide in preview, you will see that the 31 data rows with arriving flight information, are nicely spread out over the 3 tables.
Start the slideshow. DataPoint will keep the flight information up to date automatically. Whenever the first flight would be removed from the data file, then this flight or data row of the first table, will be removed as well. All rows of this table, will go up one position and the first flight of the second table, will be placed now as last flight on the last row of the first table. Same for the third row.


i will really thank for a 9 times table PowerPoint for learning
kind regards Jana momen hanafy