
Our DataPoint plugin for PowerPoint has many but one great feature to mail merge data into presentations. Mail merging is the method of taking the data from a data source like Excel or database and then generate multiple customized documents. A good example is personalized emails. A newsletter service is inserting variables like your email address, and first name into an email, and sends it out in bulk. You think that it is a personal individual email. The same can happen with letters and presentations. You can generate customized letters and presentations with personalized data from a data source, with DataPoint’s data scrolling feature.
Connect your presentation to a data source with DataPoint. Bind text boxes and other PowerPoint shapes to the first data record. Then activate data scrolling. Most likely (depending on your slide design) a step size of 1 row is used. When you have 240 data records, then DataPoint’s snapshot generation will create a new presentation with 240 individual slides. The DataPoint Enterprise edition can even do better. It can generate your 240 individual documents in PowerPoint format, PDF format, or even an MP4 movie file.
Next, to generate documents, you can also use data scrolling to show multiple data records on one slide in a slide show. A good example is showing news from an RSS feed. You connect DataPoint to a newspaper RSS feed and you bind the first news article on a slide. Then activate data scrolling and set the step time to e.g. 10 seconds. Then run the slide show. DataPoint will show news article 1 on this slide for 10 seconds, then show article 2 for the next 10 seconds, and so on until all information is shown. Then DataPoint goes further to the next physical PowerPoint slide. The same can be done with e.g. orders in queue.
This we already had. But now we have added a new feature to data scrolling. You can now add a new text box to your slide where you can show your current scrolling position on the scrolling slide. So with an RSS feed of 25 news articles, and you see a news article on the slide, you as a viewer have no indication of how many more news articles are coming. Are you looking at the first one of 25 or the last of the articles? You have no idea.
Now we have added a ‘Data Scrolling Progression Indicator’ to the slide scrolling form. Set up your data source, bind a text box to a column and go to the slide scrolling form to activate data scrolling.
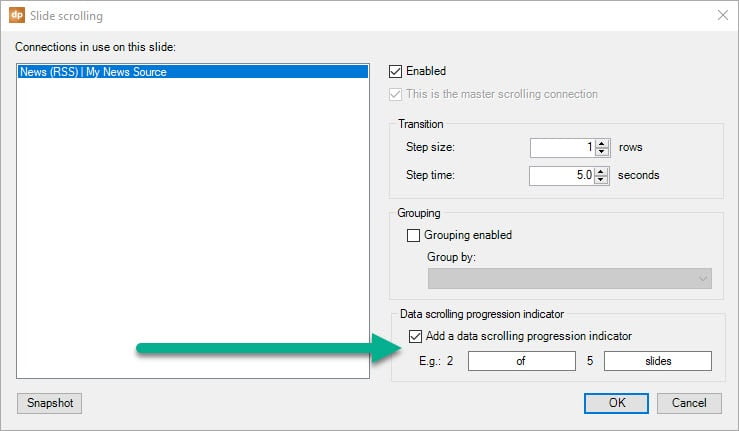
At the bottom, we have added a new option. Check the option to ‘add a data scrolling progression indicator’. You can display a possible text ‘2 of 15 slides’, or ‘2/15’, or more combinations can be achieved. Feel free to change the separator text and the ending text.
This data scrolling progression indicator option can only be set for the master scrolling connection of the current slide. This is because the master scrolling connection determines how many virtual slides are shown before going on to the next slide.
Add a new text box and open the DataPoint text box properties from the ribbon.
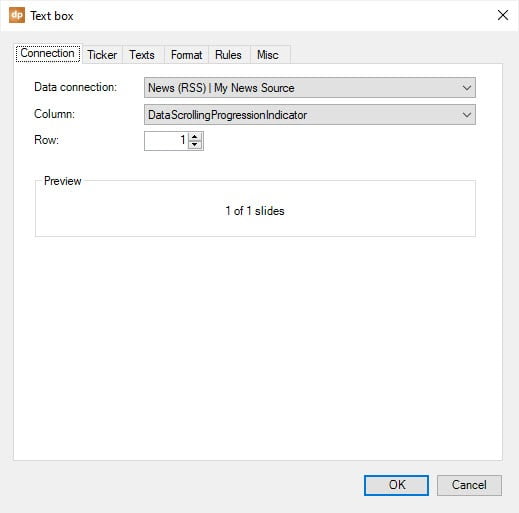
Set the connection of the text box to the connection that was identified as the master scrolling connection. Then set the column to DataScrollingProgressionIndicator. This is a virtual column that is not really coming from your data source but is added by DataPoint.
The preview will show something like ‘1 of 1 slides’. Note that this is just a dummy text and probably is not correct at this moment.
Hit OK and run the slideshow or generate a snapshot presentation. During the slide show, it will show 1 of 25 slides, then 2 of 25 slides, etc so that you will always have an indication of how far you are with the data scrolling on this slide.
Here we display the RSS feed of The European Space Agency (ESA). We show the title, its featured image, and the new data scrolling progression indicator.

This feature is now made available in the latest update of DataPoint. Update your DataPoint installation to get this new feature in.


An excellent update with the great function, thanks for that!
Thanks for your feedback!
Sir your tutorials blog is very helpful and informative.
2. i have a question, that i have prepared a text animated line on power point 2016, but while scrolling on the presentation page, floating text line after first 3 to 4 words other all words merged between each other and does not shows properly. what is the solution that full line all text float properly.
Can you have a look at the wrap text option of your textbox? I think you need to uncheck the wrapping.