
 Real-time data on your information screen is hot to look at, and not that difficult to produce. The most used tool to create presentations, Microsoft PowerPoint, in combination with the DataPoint add-on, brings real-time data to your slides or slideshows.
You can easily connect a text box, chart or table to your factory production figures or KPI’s (key performance indicator), and have it updated at regular intervals. Every 200 milliseconds, or every minute, depending on your needs. In an earlier article, we showed already the great capability of showing dynamic dashboards, but here in this article, we will show how you can use text boxes and assign dynamic rules to the values.
Using Rules
Rules on top of your dynamic information is great to visualize critical information. A number needs to be on your screen, but assigning a color to a number, gives an immediate and better overview of the situation.
Imagine that you are showing production figures of your factory. And you have multiple production lines. You could show how many products are assembled per hour, per production line. Normally your personnel can produce 200 articles per hour. So you could display that production line in green whenever you can measure 200 articles produced over the last hour.
Whenever the count drops below 150, then you probably have a problem on the production line and you have to react immediately. A visual red rectangle on that production line, would draw immediate attention. That is why we have rules in DataPoint.
Setting up a Presentation
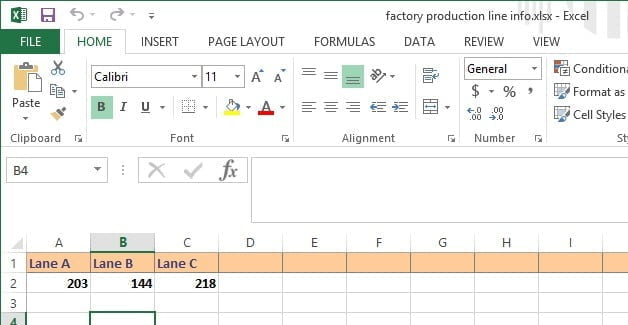
First, I start with a normal PowerPoint presentation. That is the strength of DataPoint. An image is set as background and 3 text boxes are linked to our Excel datasheet. The connection information is set here to refresh the content, every 3 seconds while the slideshow is running.
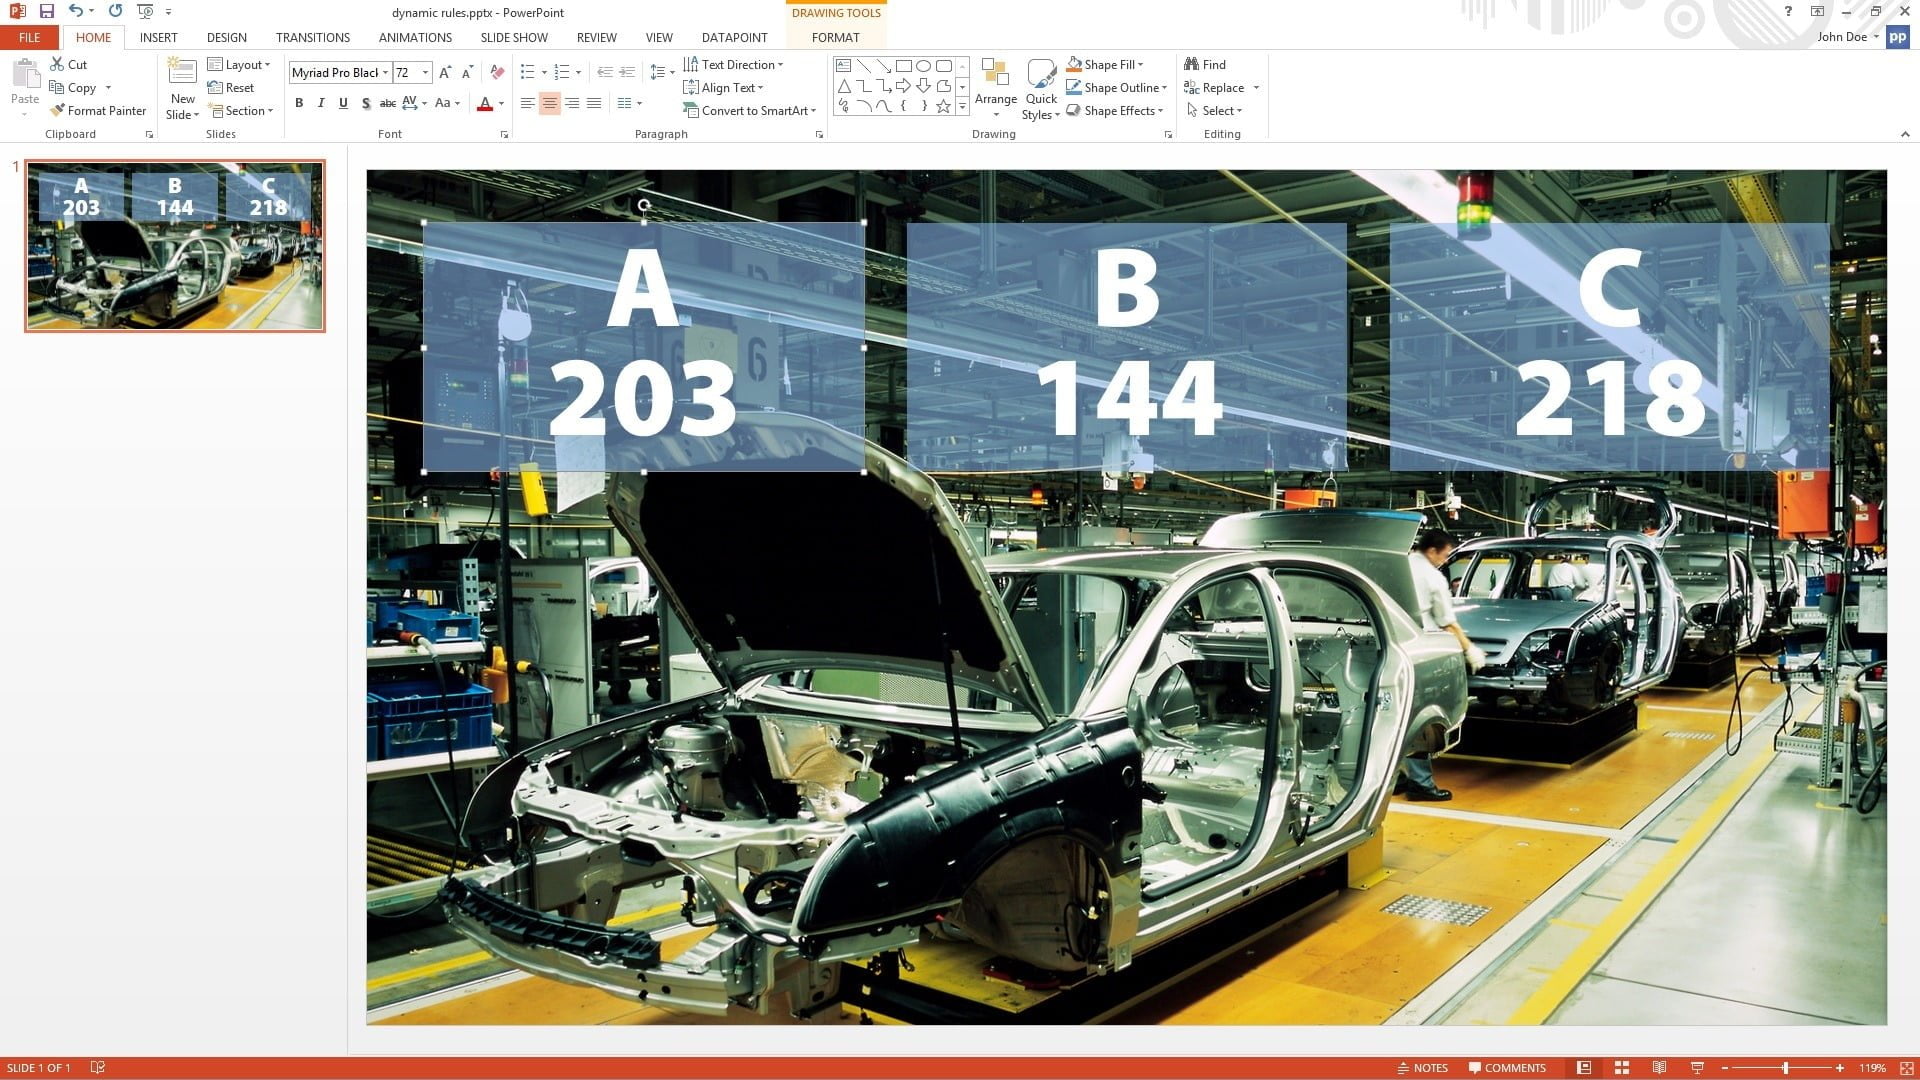
Each of the three text boxes on this slide, is dynamically linked to a cell of the Excel datasheet. One cell per production line. This is all normal DataPoint functionality. If you are new to linking dynamic text boxes with DataPoint, then read this article first.
Creating Rules
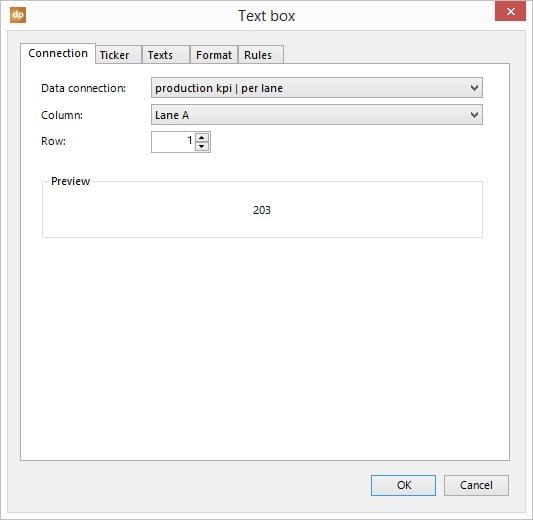
Select the text box again and open the link properties via the DataPoint, Text box button. Click to open the Rules tab.
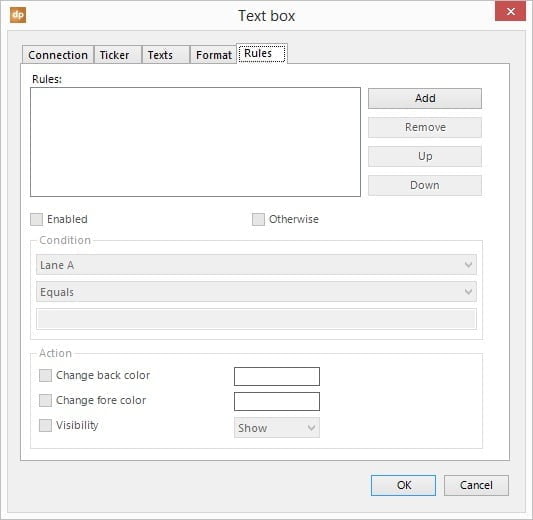
Click the Add button to insert your first rule. A new empty rule is added to the rules list. Below the list of rules, you see 2 important panes. The Condition pane and the Action pane. Or you can see this as the IF … THEN panes.
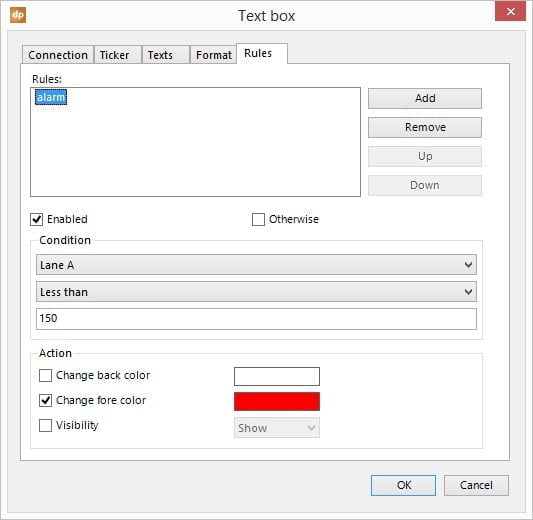
Give the rule a name by clicking in the text of the rule. Enabled is checked by default, so that is fine. At the Condition pane, select Lane A as the column. From the comparison combobox, choose Less than and set the value to 150.
Now at the action pane, you can specify, what to do when the condition is met. You can change the back color of the text box (the fill), or change the fore or font color, or make the text box visible or invisible.
For this sample, we choose to change the fore color and set the color to red. So whenever the value of the column Lane A is dropping below 150, then the text or the number is placed in red.
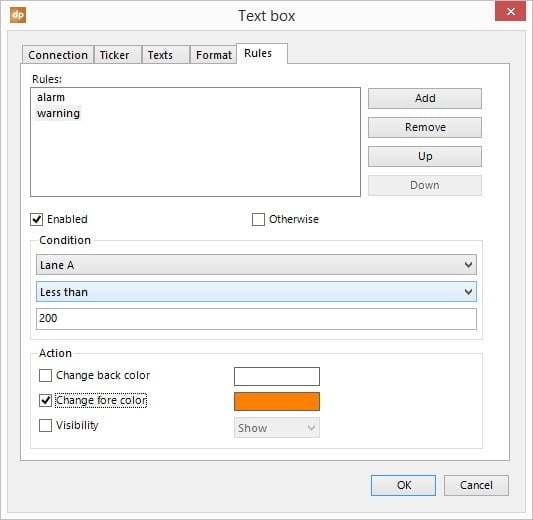
Let’s add a new rule. We call this rule warning. The validation happens on the same column, so the first combobox of the condition pane, is set to Lane A. The comparison is set to Less than and the value to 200. At the action pane, we set to change the fore color and set the color itself to orange.
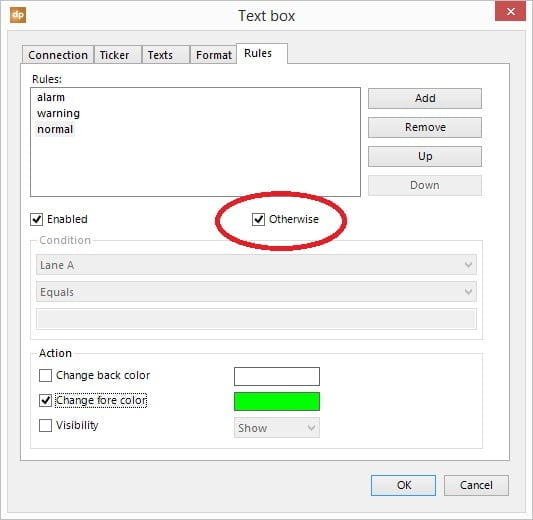
And finally a third rule for the situation that we are not in alarm or warning condition. We add a new rule, and then for the first time, we check the Otherwise checkbox. This indicates that this is the last or normal rule. When no previous rules were met, then these action settings are used instead. So leave the condition empty, but set the fore color to green, at the action pane. Hit OK to save these rules.
Here in these 3 sample rules (actually 2 and one otherwise rule) we used a fixed value of 200 at the condition. You can also compare the value of the selected column, to another column, so not being a fixed value or number in your rule. Whenever you want to compare e.g. the value of Lane A with the value of Lane C, or any other column, then just use square brackets [ and ] around the column name, like so [Lane C].
Also you can use 2 variables or functions at the condition. Use =DATE() for today and =NOW() for current time.
Here in this article, we used text boxes to demonstrate the functionality of rules. These rules can also be set on tables, or on specific cells or a given cell range of a table.
Running the Slideshow
Finally you can start the slideshow and DataPoint will scan for updates every 3 seconds, as it is defined in the connection settings. Whenever there is an update on the data, the information on your screen will be updated and the rules will fire and set the fore color of the text box text accordingly.


I am having difficulty using conditional formatting inside a table that I am using as a display. I would like to make the number in Column B red if the number is Less Than the number in Column B.
In the meanwhile, we have answered and solved your problem via your trouble ticket already.
Can you use conditions and rules to create an instructor and student version of a slide deck in PowerPoint?
And what would be the difference between instructor and student version? Are you going to include some notes for instructors that are then hidden for the students? Yes, such a thing is possible via the visible action.
I am having difficulties with rules in table, I select column and set it to equals and it seems to act in same method of contains i.e. f1 equals available make colour green – but then it changes even those that have word unavailable. To further complicate I am trying to run the rule on 7 columns in a scrolling table.
Thanks Eugene, We can definitely look into this but please create a trouble ticket for this at https://presentationpoint.com/support/. We cannot handle individual problems here on this page. Thanks for your understanding.
Please send in some screenshots (of all files) to illustrate your problem.
Please let me know the rules doesn’t work in trial version? secondly I am also facing the date formatting issue. I wish to have MM/YYYY, format. it is not working
Rules also work in the trial version. Please create a ticket with more info for us at the support section of our website and we will look into this for you.