In this video, we explore how to create a crypto dashboard in PowerPoint to show real-time pricing of cryptocurrencies.
See the video above to see the crypto dashboard in PowerPoint in action.

The first step whenever you are creating a data-driven PowerPoint presentation is to find the data source you want to use. In this case, we found Binance – one of the leading cryptocurrency exchanges with an API we could use to access up-to-date cryptocurrency pricing.

Binance crypto dashboard
Now that we know where to get our data from, we can create our crypto dashboard in PowerPoint. I used a stock photo background picture, then added some text boxes with the title and label.


PowerPoint crypto dashboard
Now to create the cryptocurrency live price data connections. To create live data connections in PowerPoint, we use our DataPoint PowerPoint add-on.

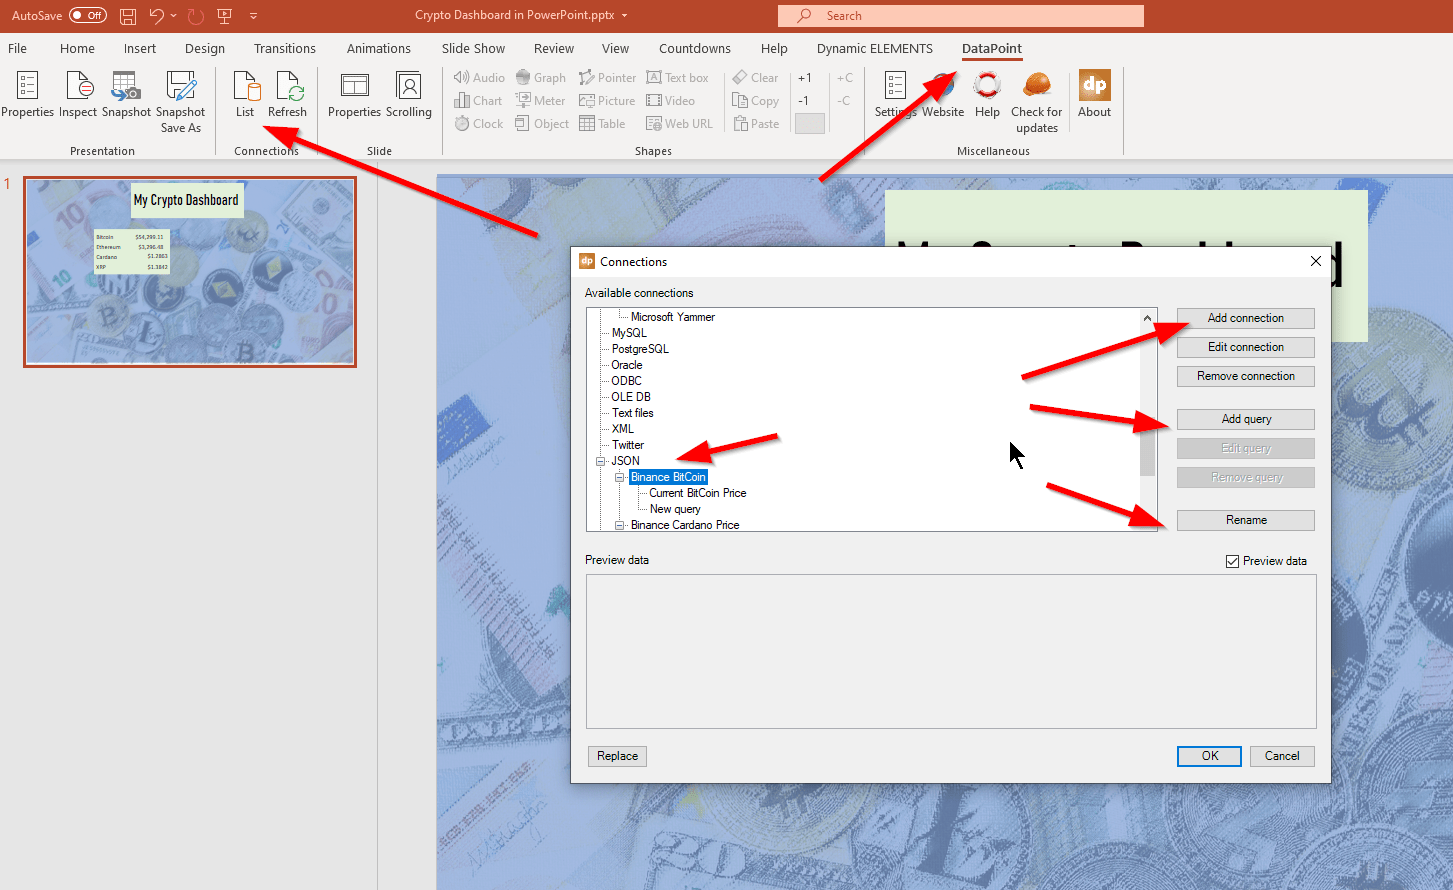
With DataPoint installed, I click on the [DataPoint] menu within PowerPoint, then click on the [List] command. The format of the Binance feed is JSON, so I create a new JSON connection using the link from the Binance API.

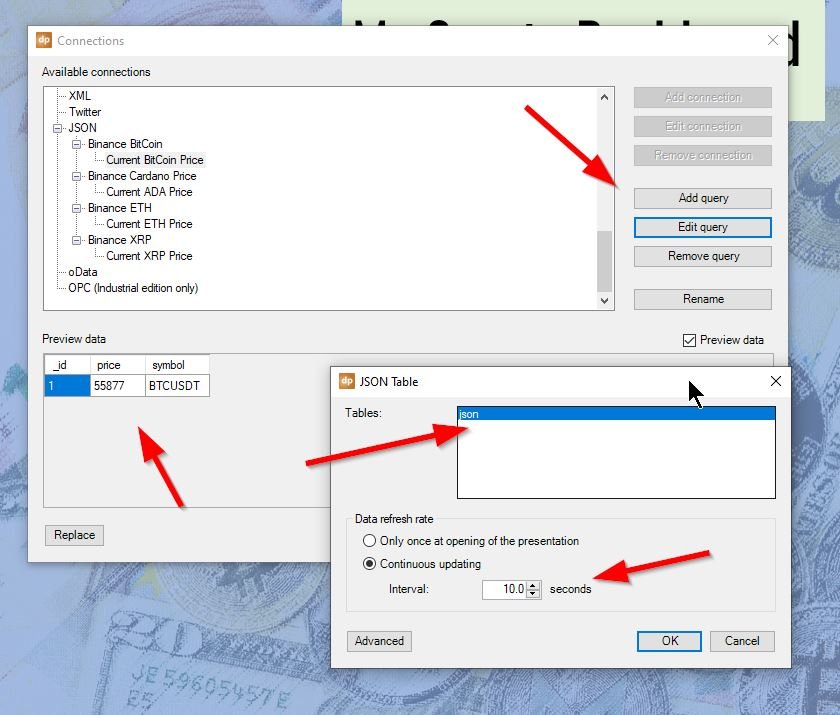
Once that is done, I create a [query] and click on the JSON table. As a best practice, I rename each connection and query as I go to make it easy to determine what each connection and query is for later.

crypto add JSON connection - PowerPoint
For the [add query] option, I choose the JSON table. I also choose the intervals as to how often I want the data to refresh. In this case, I chose every 10 seconds so that you can quickly see updates when the PowerPoint is running.
add query to crypto dashboard
Then I create a text box next to the first label – Bitcoin and then click on the text box itself, the [DataPoint], then [text box] from the DataPoint menus in PowerPoint. This pulls up a window where I can choose the data connection and query to connect this text box to. In this case, I choose Bitcoin.
connect text box to Bitcoin price
Now you repeat the process of creating new text boxes next to each currency label and then connecting each text box to it’s respective cryptocurrency price using DataPoint.

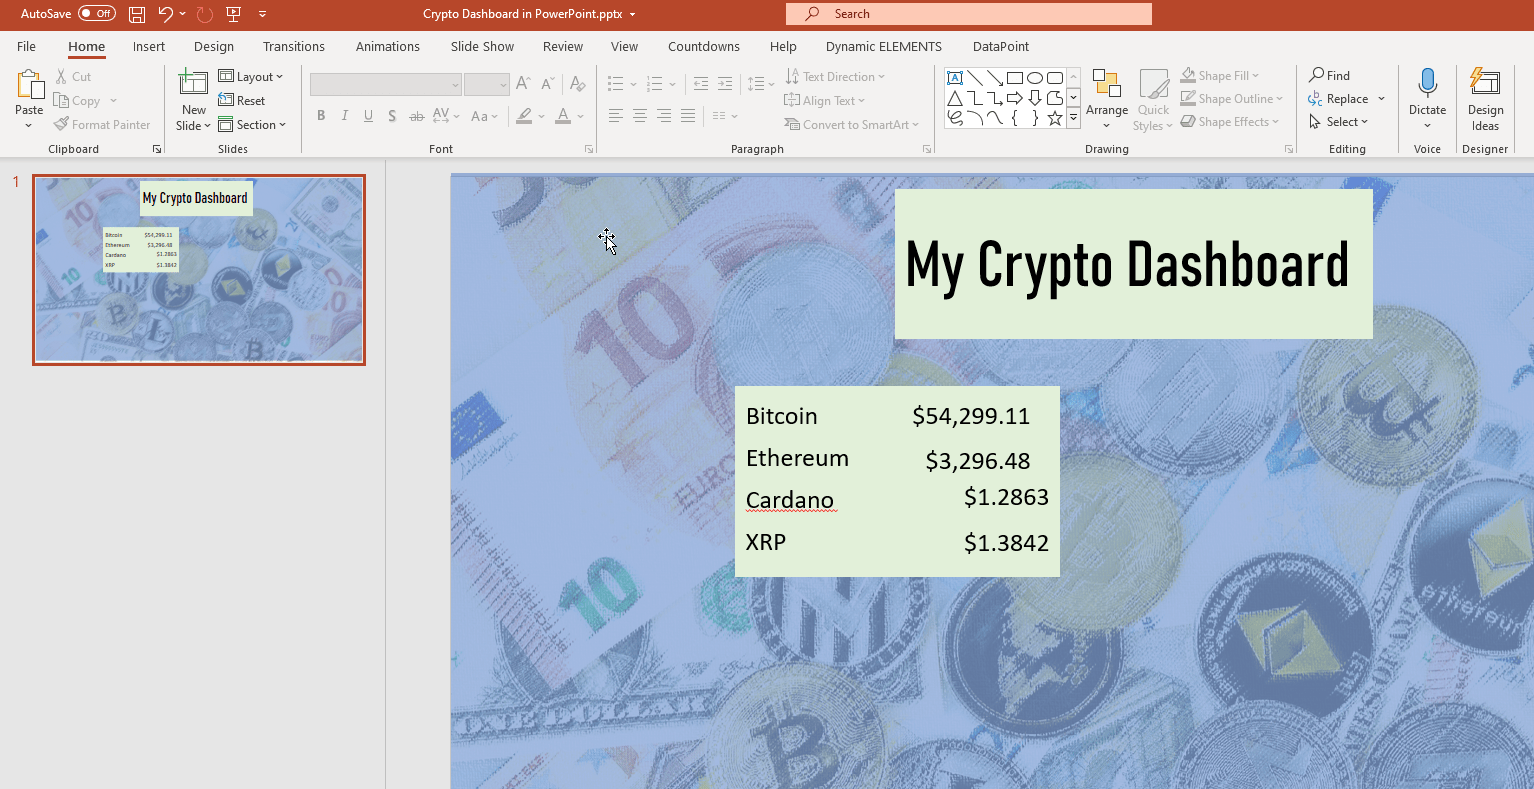
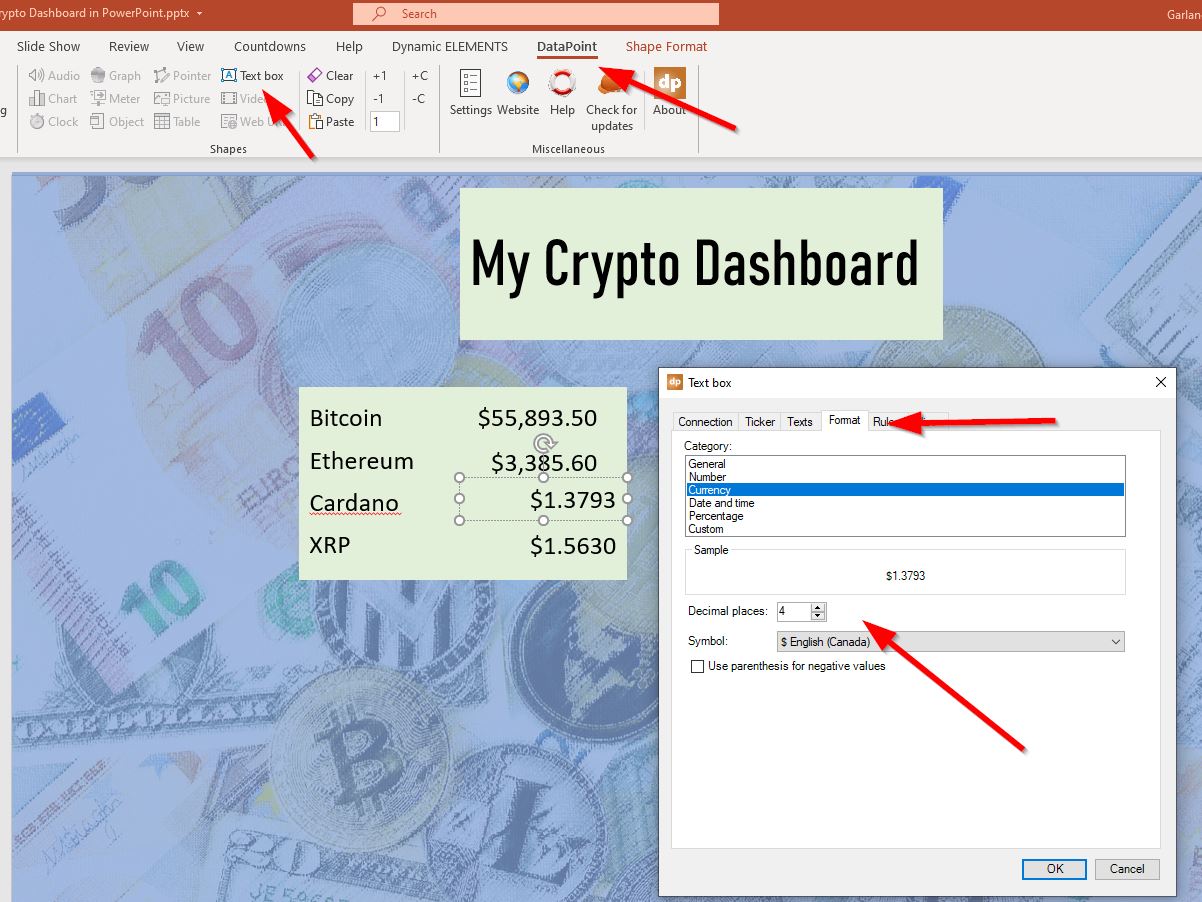
In the case of Cardano and XRP, I changed the data to show the price to 4 decimal places instead of two. This is because Cardano and XRP are both currently under $2 so a minor change such as from $1.3825 to $1.3849 wouldn’t show a change if it was only to two decimal places and you may think your dashboard isn’t working for these prices.

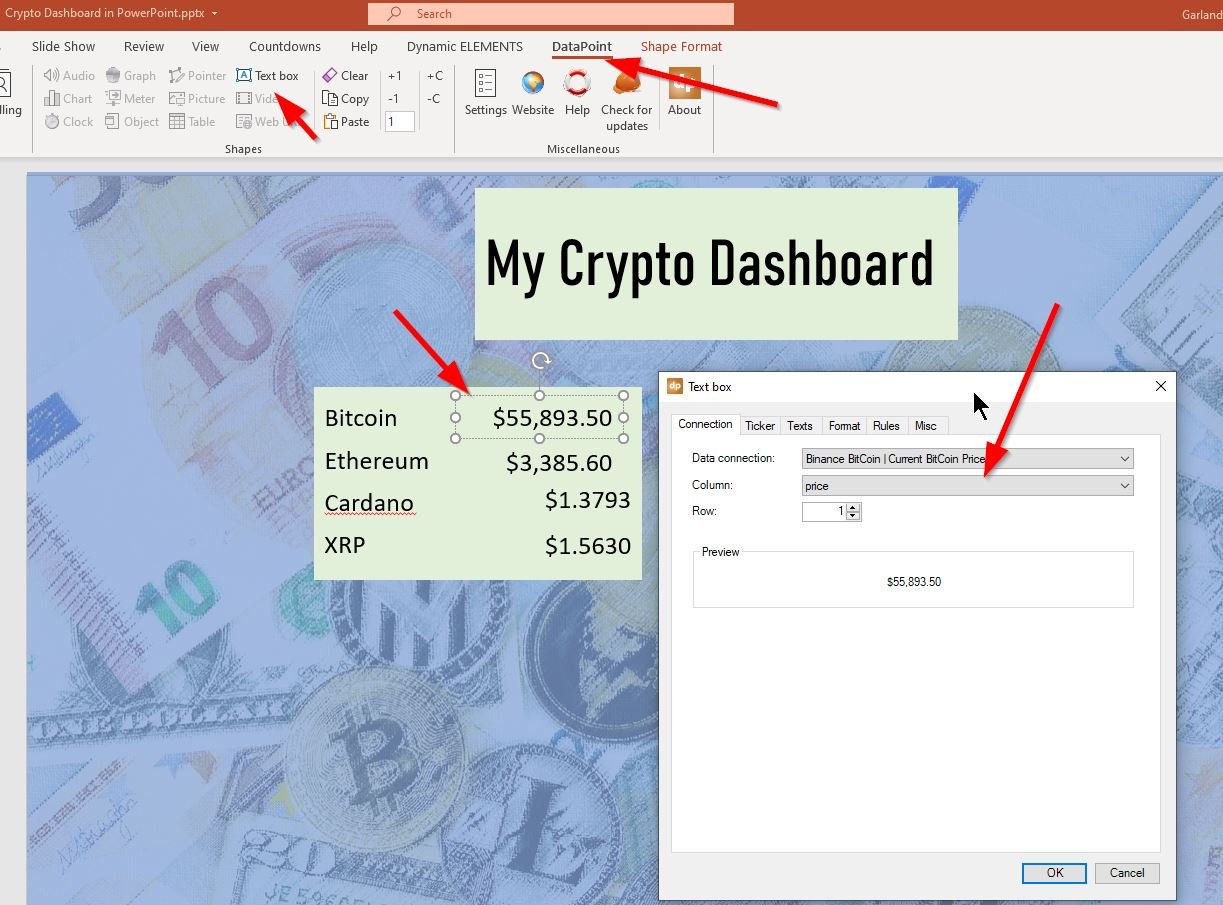
I change this by clicking on the text box I want to change, then choosing [DataPoint], then [text box] from the DataPoint menu, then clicking on [Format], and choosing the decimal point I want. There are additional options here such as [Rules] which can provide options like changing the text or background color based on the data.

change decimal point
Once you have all the text boxes connected, save and run your presentation. See the video above for how it works.

Have questions about setting up your own crypto dashboard or other dashboards? Contact us.

Pin It on Pinterest

Share This