
 PowerPoint™ and Excel™. Two popular Microsoft products used extensively in business. But which one is more powerful for creating business reports?
Since a lot of the data needed for reports is often already in Excel, many people automatically use Excel to create reports and charts for reporting to management and stakeholders. But, in our experience, we have found that PowerPoint is usually the better business reports tool.
Here’s why:
1. PowerPoint is Made for Presenting Reports
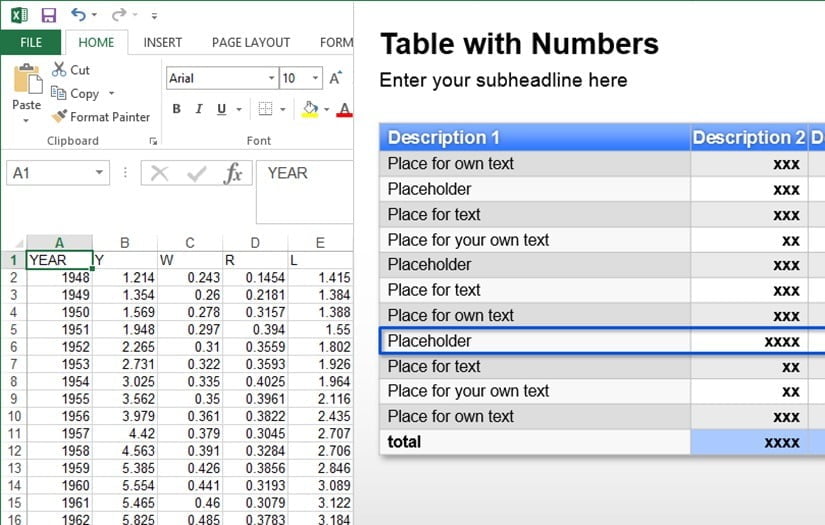
Excel’s main reason to be is to collect numbers and data and perform calculations. Yes, it does offer charts and graphs, but no real way to sort multiple charts and show them easily to a group. PowerPoint, on the other hand is made for presenting.
PowerPoint’s “slide show” approach lets the users to easily move from one slide to another with a simple mouse click and move forward and back through the presentation. With Excel, the user has to flip back and forth through worksheets which is very awkward.
2. Ordering Business Presentation
Using the slide sorter view in PowerPoint, creating and ordering the presentation is as simple as dragging the slides around to change the order.
3. Greater Multimedia Capabilities
PowerPoint makes it easy to insert or drag pictures or even videos onto the slide. The user can add pictures of the products, people or stock photo metaphors along with illustrations and charts.
4. Cohesive Theme
With PowerPoint, the user can create a master theme and have the colours, graphics, font, font size, etc. repeated throughout the presentation. If the user wants to change any of these, the entire presentation is updated. The theme can be used for multiple presentations.
5. Better Chart Choices
While Excel does a good job on standard chart choices like line, pie and bar charts, PowerPoint also lets the user work with more unique charts. Here are some examples:
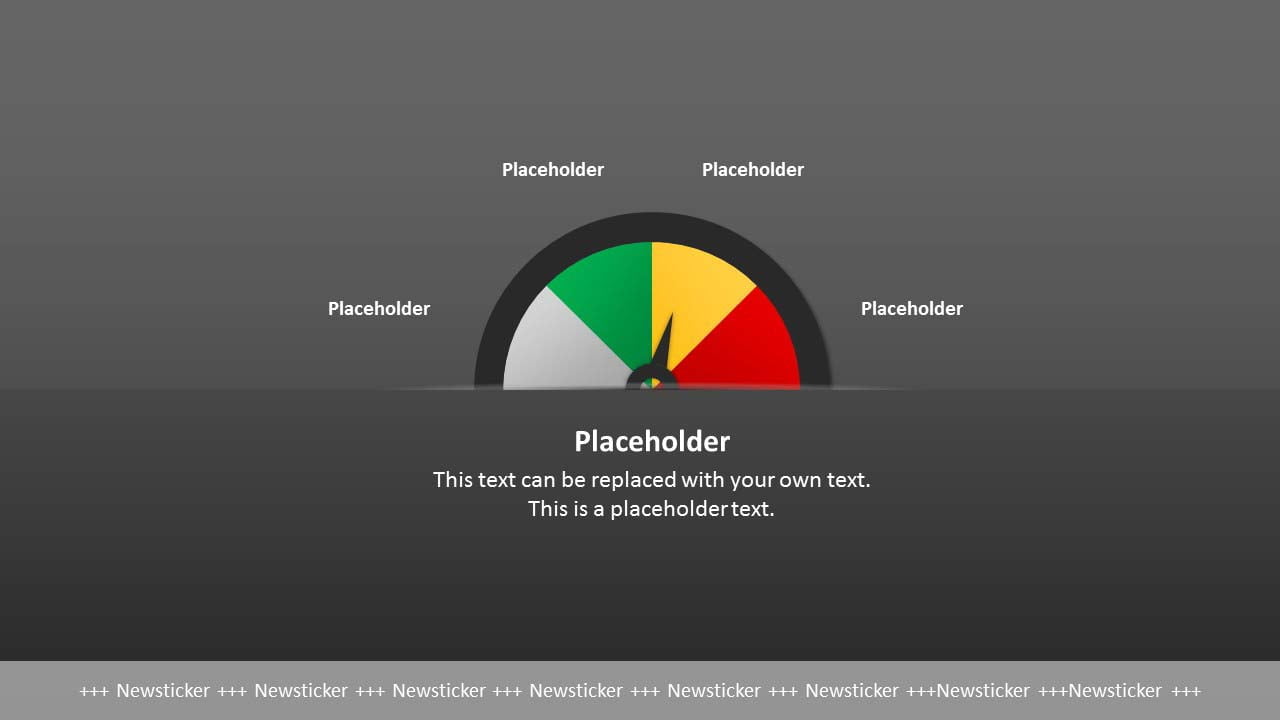
- Tachometer/Speedometer: While there are some possible tachometer charts for Excel, there are many more tachometer templates for PowerPoint. Here is an example of a PowerPoint tachometer template.
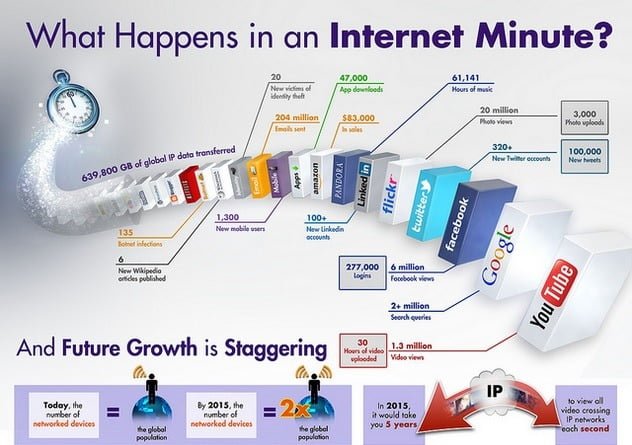
- Infographics: PowerPoint also has the capability of showing the data as Infographics. Infographics are charts and diagrams that are used to represent information or data. They tend to be higher impact. Her is an example of how an infographic works.
6. Automatically Updated Data
Using PowerPoint plugins like DataPoint, the user can link the presentation to data sources like Excel, RSS feeds, and databases. Now the data will automatically update with the latest figures daily or even hourly. The latest sales, profitability and any other data is already updated in the presentation when the user is ready to begin.
7. See Only The End Result
Instead of showing a spreadsheet with numbers and formula, the user can use a data-enabled PowerPoint presentation to skip past the raw data and show it in a more visually pleasant format.
8. Distribution
PowerPoint makes distribution of the business report easy. The user can distribute the report:
- as a self running PowerPoint presentation
- printed slides
- as pdf document
- by broadcasting it company-wide using MessagePoint
- by uploading it to SlideShare so the user can share it over the Internet with the team.
Conclusion
With a data driven PowerPoint, the user can get the best of both worlds. All the power, raw data and calculating power of Excel with the enhanced presenting and multimedia capabilities of PowerPoint. For the next business report, we recommend PowerPoint over Excel.

