We have 3 possible scenarios for displaying weather.
- This is a dedicated weather add-on for PowerPoint to display weather information in a presentation. This is very easy to use and it can show current weather information and forecasts. If you need to display the weather information then use this option.
- When you need to display more than just a weather, try our DataPoint solution or combine with other Dynamic Elements add-ons. It has the same weather data provider (as in the first solution). This is very easy to use and can combine information from other data providers like database and Excel information.
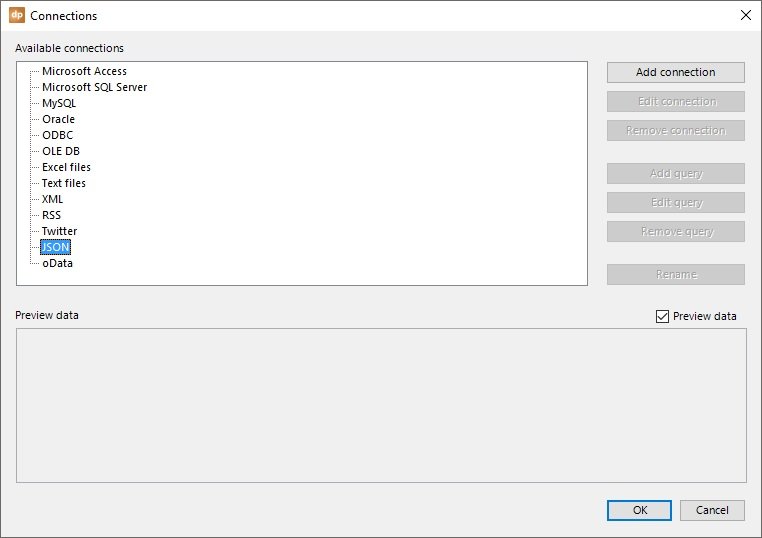
- The weather information from any weather source or weather API is typically communicated with XML or JSON format. DataPoint can use any XML or JSON data feed. So, if you want to have a full flexibility yourself, then take full control with the XML or JSON data providers of DataPoint.
This blog article covers option 3.
Sign up at Forecast.io and get your API key in order to retrieve data. Documentation of what and how to retrieve weather information, can be found here.
Typically a call looks like this:
https://api.forecast.io/forecast/APIKEY/LATITUDE,LONGITUDE
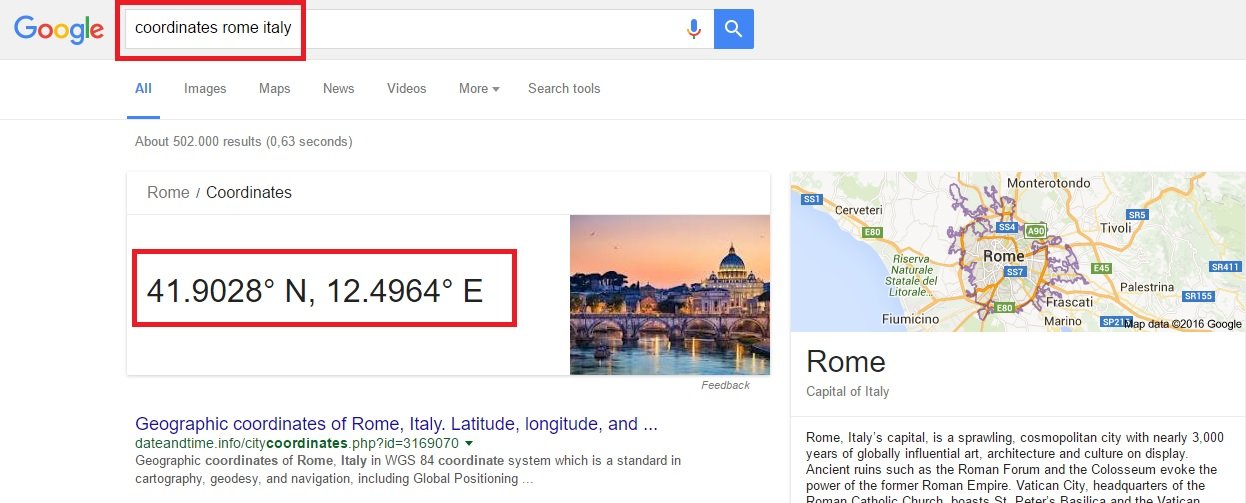
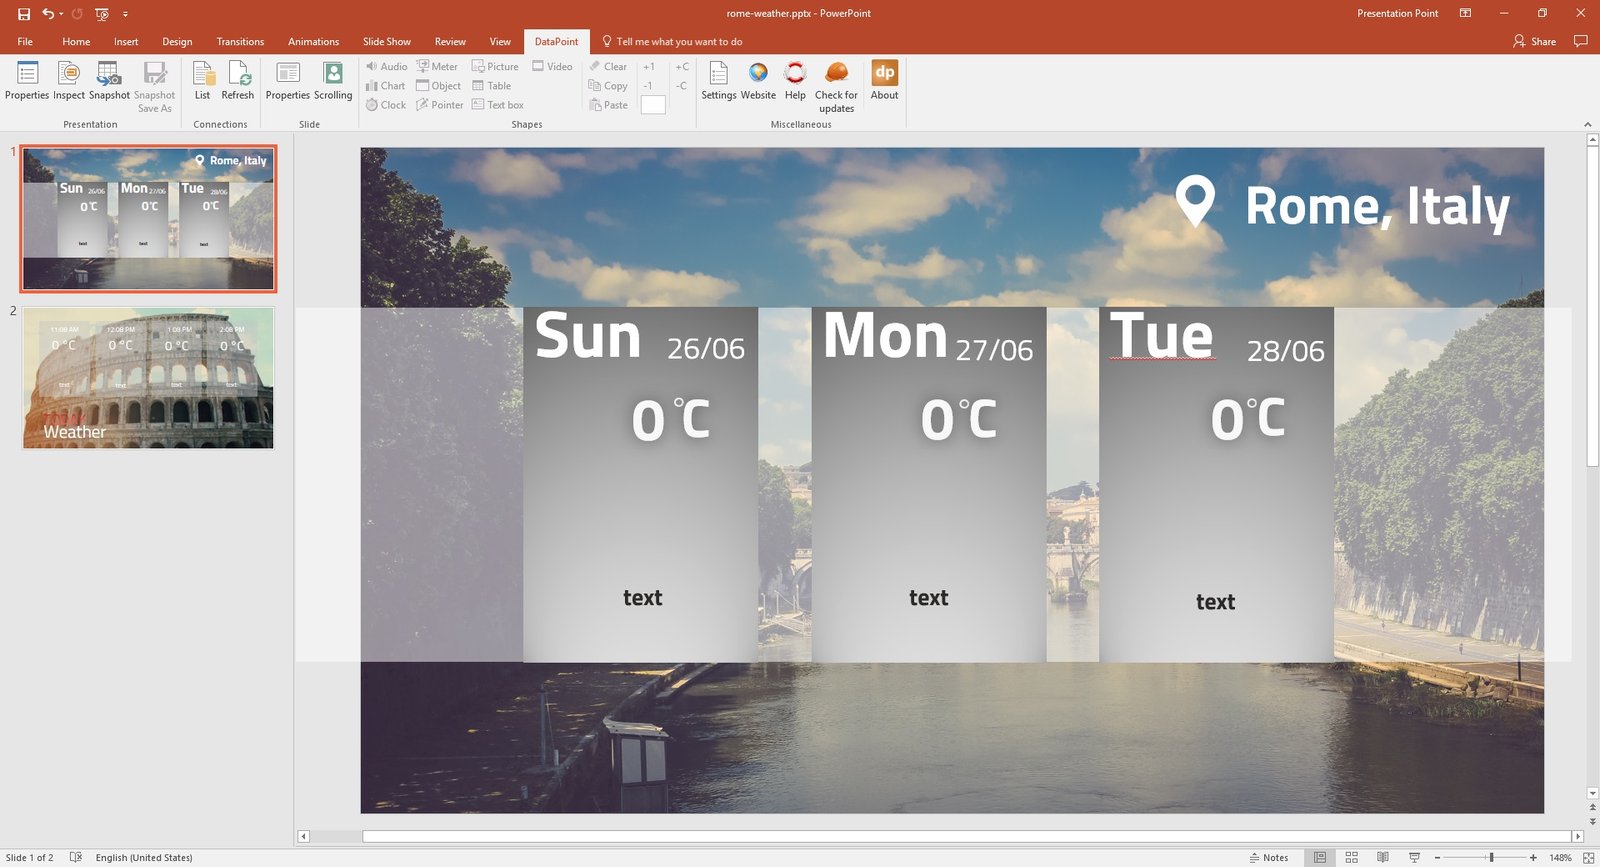
The APIKEY is the unique key that you get from them and identifies you and your application. The latitude and longitude are geographical coordinates to identify a location or city. In this article we will create a dynamic weather display for Rome in Italy. So we have to look for the coordinates of Rome. Use the Google search engine for this.
https://api.forecast.io/forecast/52cec5ff313a4d19b60540cfe89675a5/41.9028,12.4964
52cec5ff313a4d19b60540cfe89675a5 is our API key that we got from our sign up process at forecast.io. We will change this API key after publication of this article. So use your own API key instead. Using this key in your weather display presentation will not work. You will have to use your own key. The reason for this is that, you will get a free number of calls per day, and otherwise we would exceed that number of calls if everyone would use the same together.
41.9028,12.4964 are the coordinates for Rome, Italy, as we got them from our Google search.
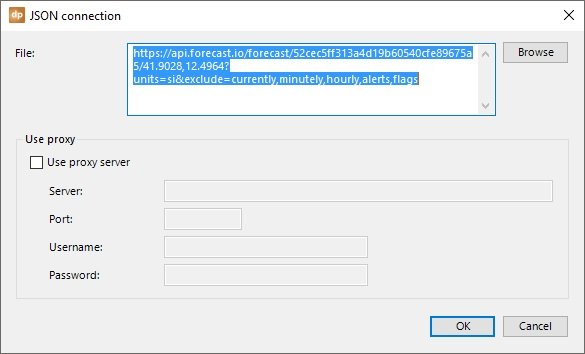
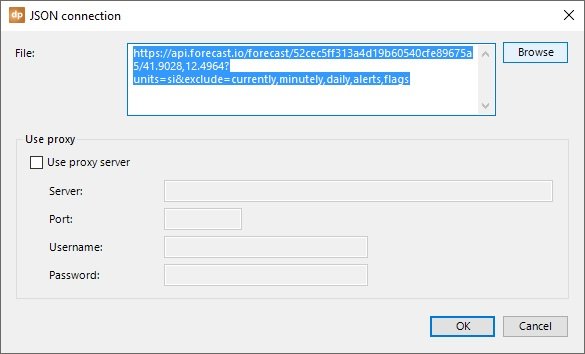
https://api.forecast.io/forecast/52cec5ff313a4d19b60540cfe89675a5/41.9028,12.4964?units=si&exclude=currently,minutely,hourly,alerts,flags
There are some extra parameters added for this purpose. Units=si returns the information as degrees in Celsius. And we want to include daily information only.
https://api.forecast.io/forecast/52cec5ff313a4d19b60540cfe89675a5/41.9028,12.4964?units=si&exclude=currently,minutely,daily,alerts,flags
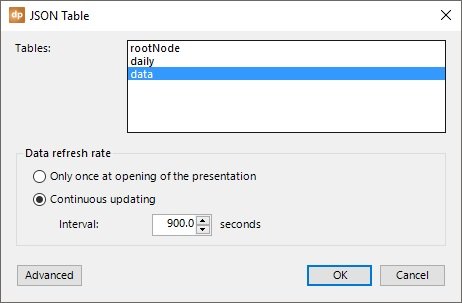
You will see that currently, minutely, daily, alerts and flags are excluded and that basically only hourly intervals are included with this call.
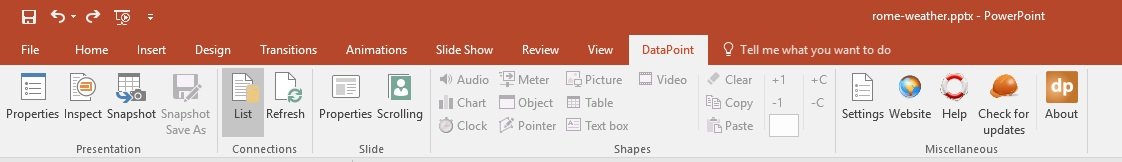
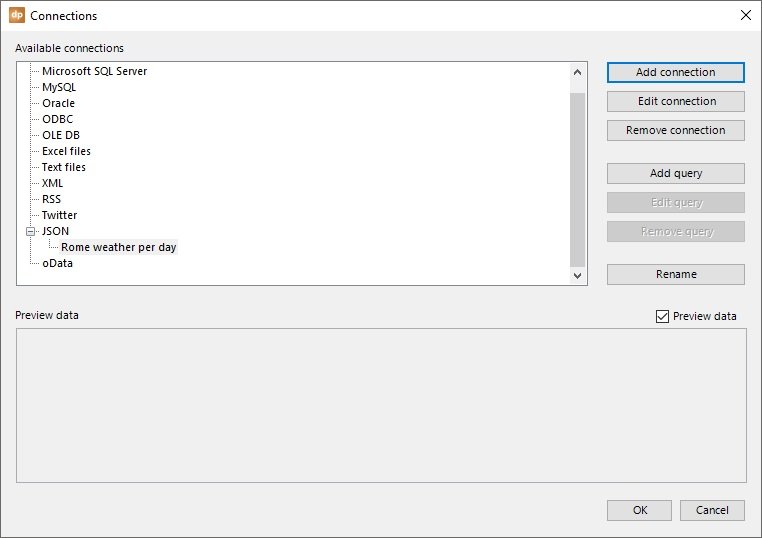
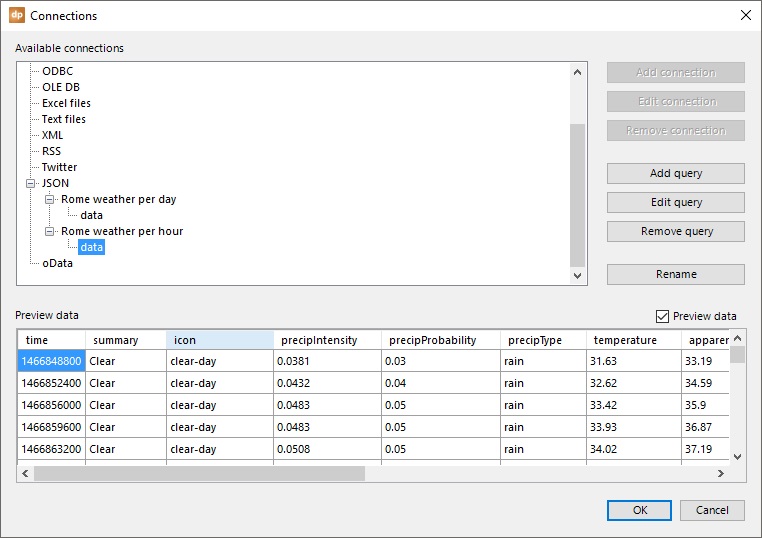
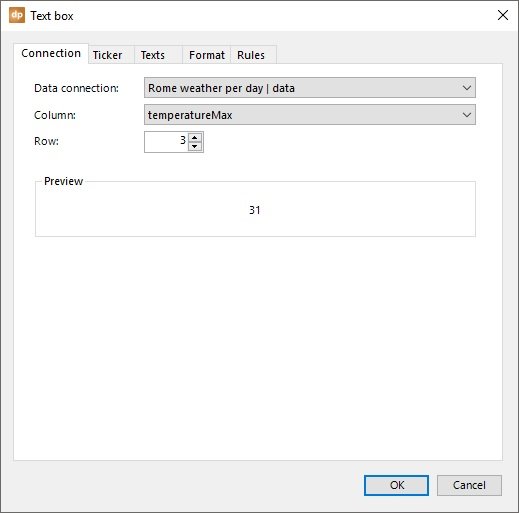
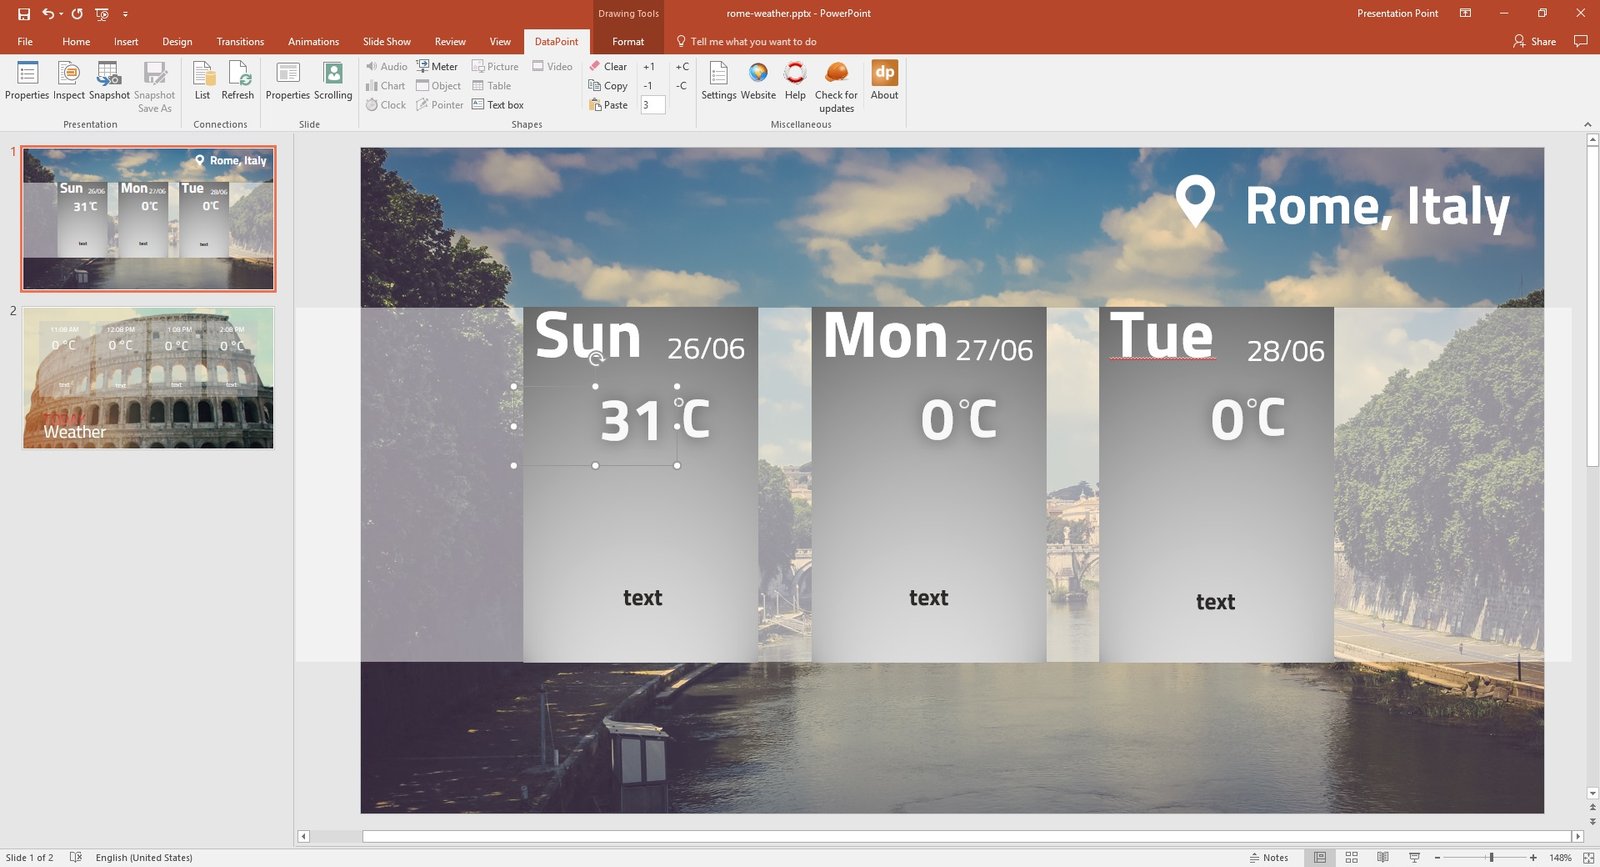
Click OK to close and now we have 2 weather queries set up in our PowerPoint presentation. Now the fun part starts as we are going to use the information on our weather display slides.
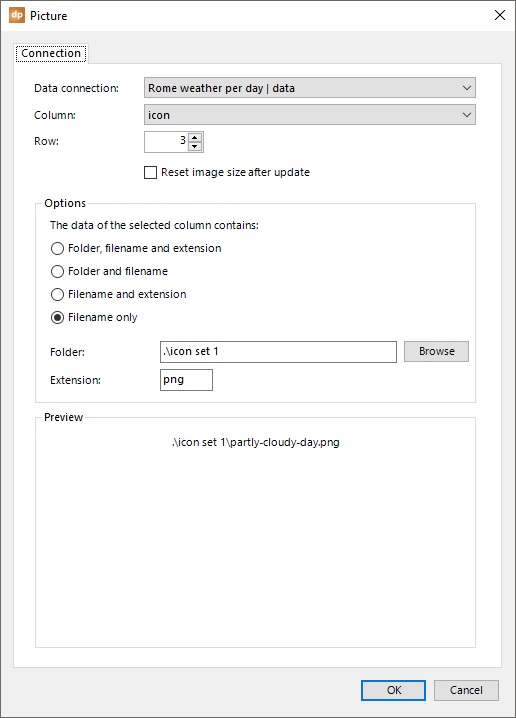
At the option The data of the selected column contains, switch it to filename only. Set the folder to .\icon set 1 and enter png as an extension.
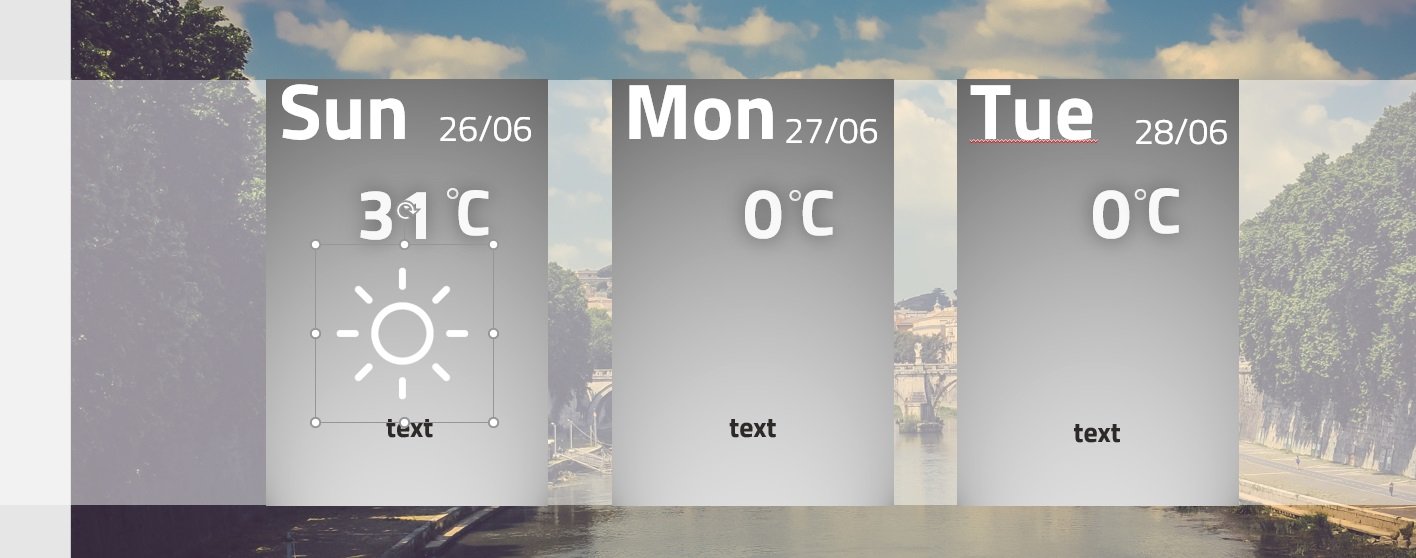
The weather API communicates the weather status as words like clear-day, clear-night, rain, snow, sleet, wind, fog, cloudy, partly-cloudy-day, or partly-cloudy-night. We have a folder with all these words as images. That is how we can translate a weather condition text into a weather icon.
Click OK to close.