
A PowerPoint dashboard with real-time data on gauges is very easy to build with the DataPoint for PowerPoint add-on. Use DataPoint to connect your Microsoft PowerPoint presentation to a data source of your choice. Often databases and spreadsheets are used. Let’s build a dynamic gauge together in this blog article.
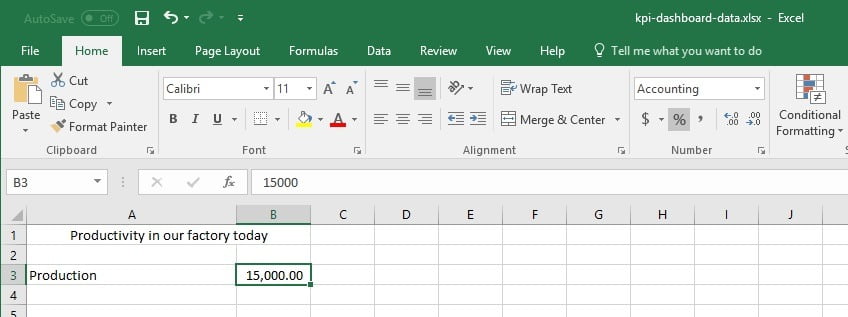
The raw data that we want to visualize is available in a Microsoft Excel spreadsheet, but this can be anything else.

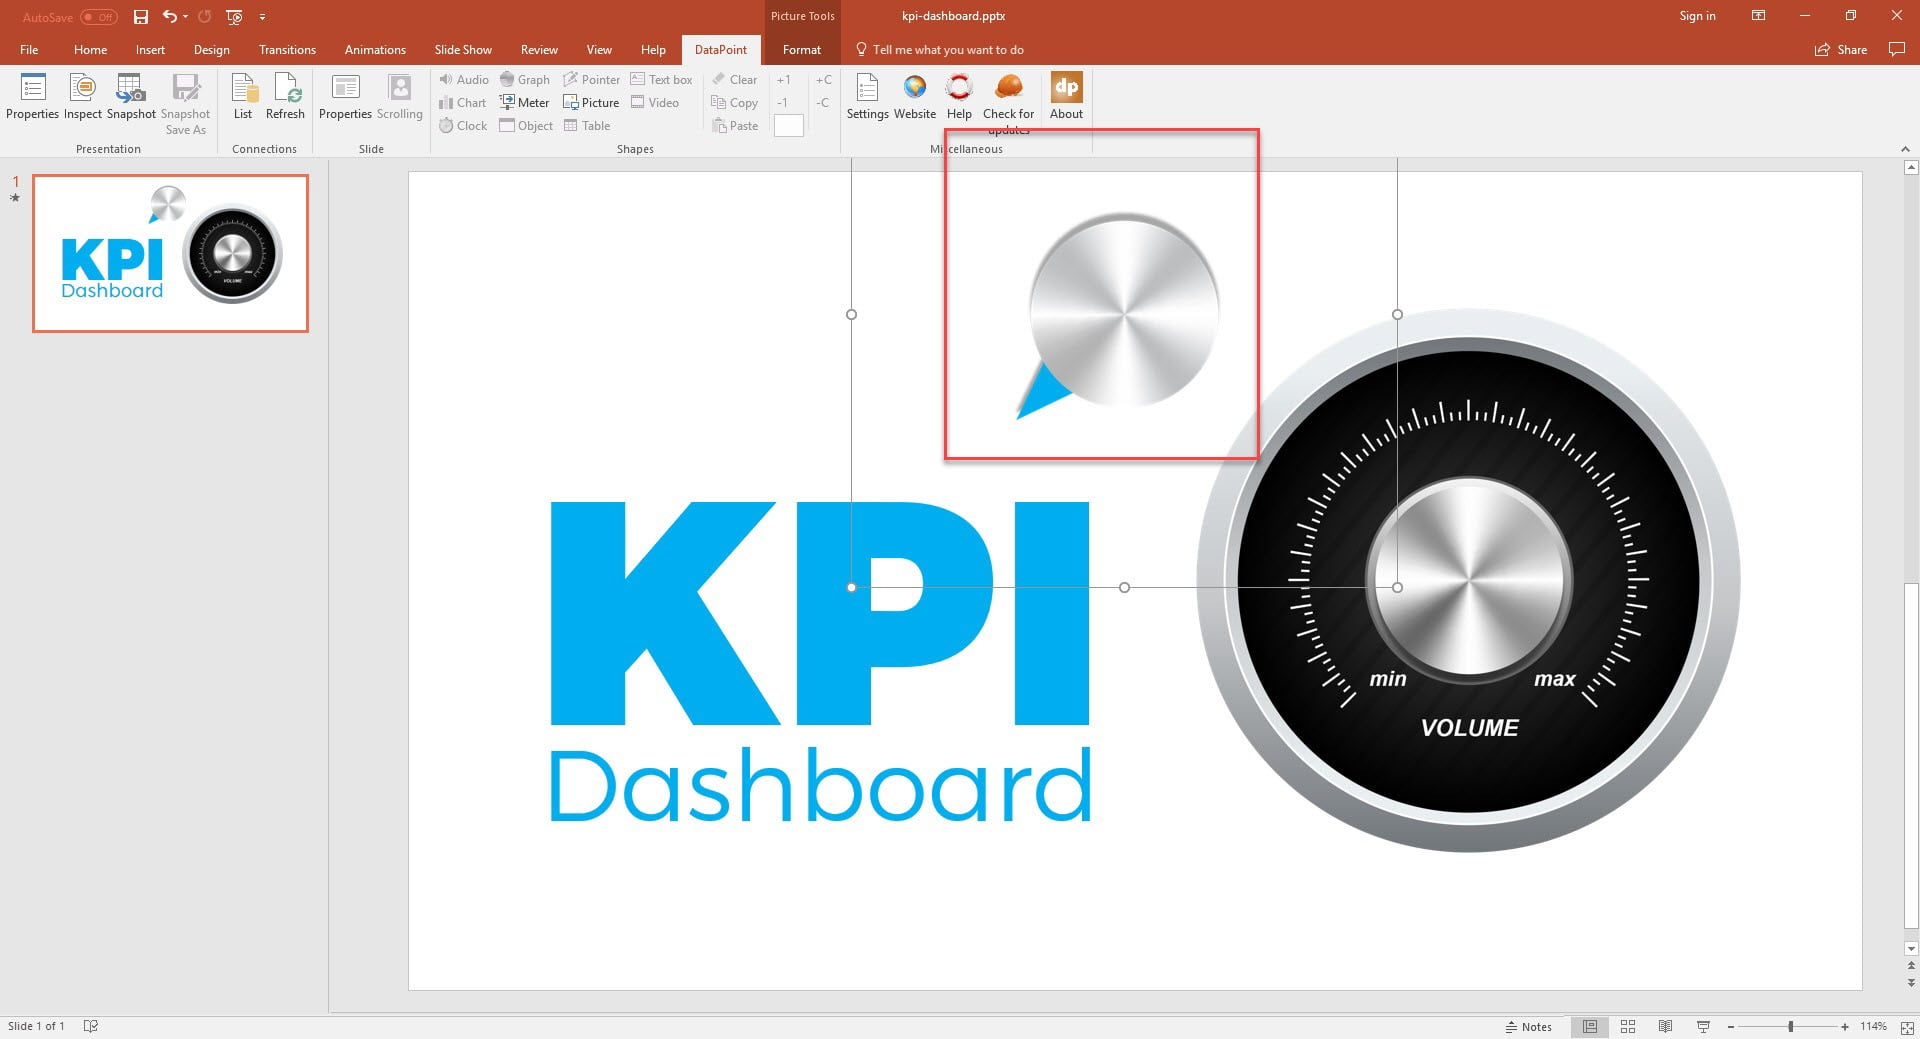
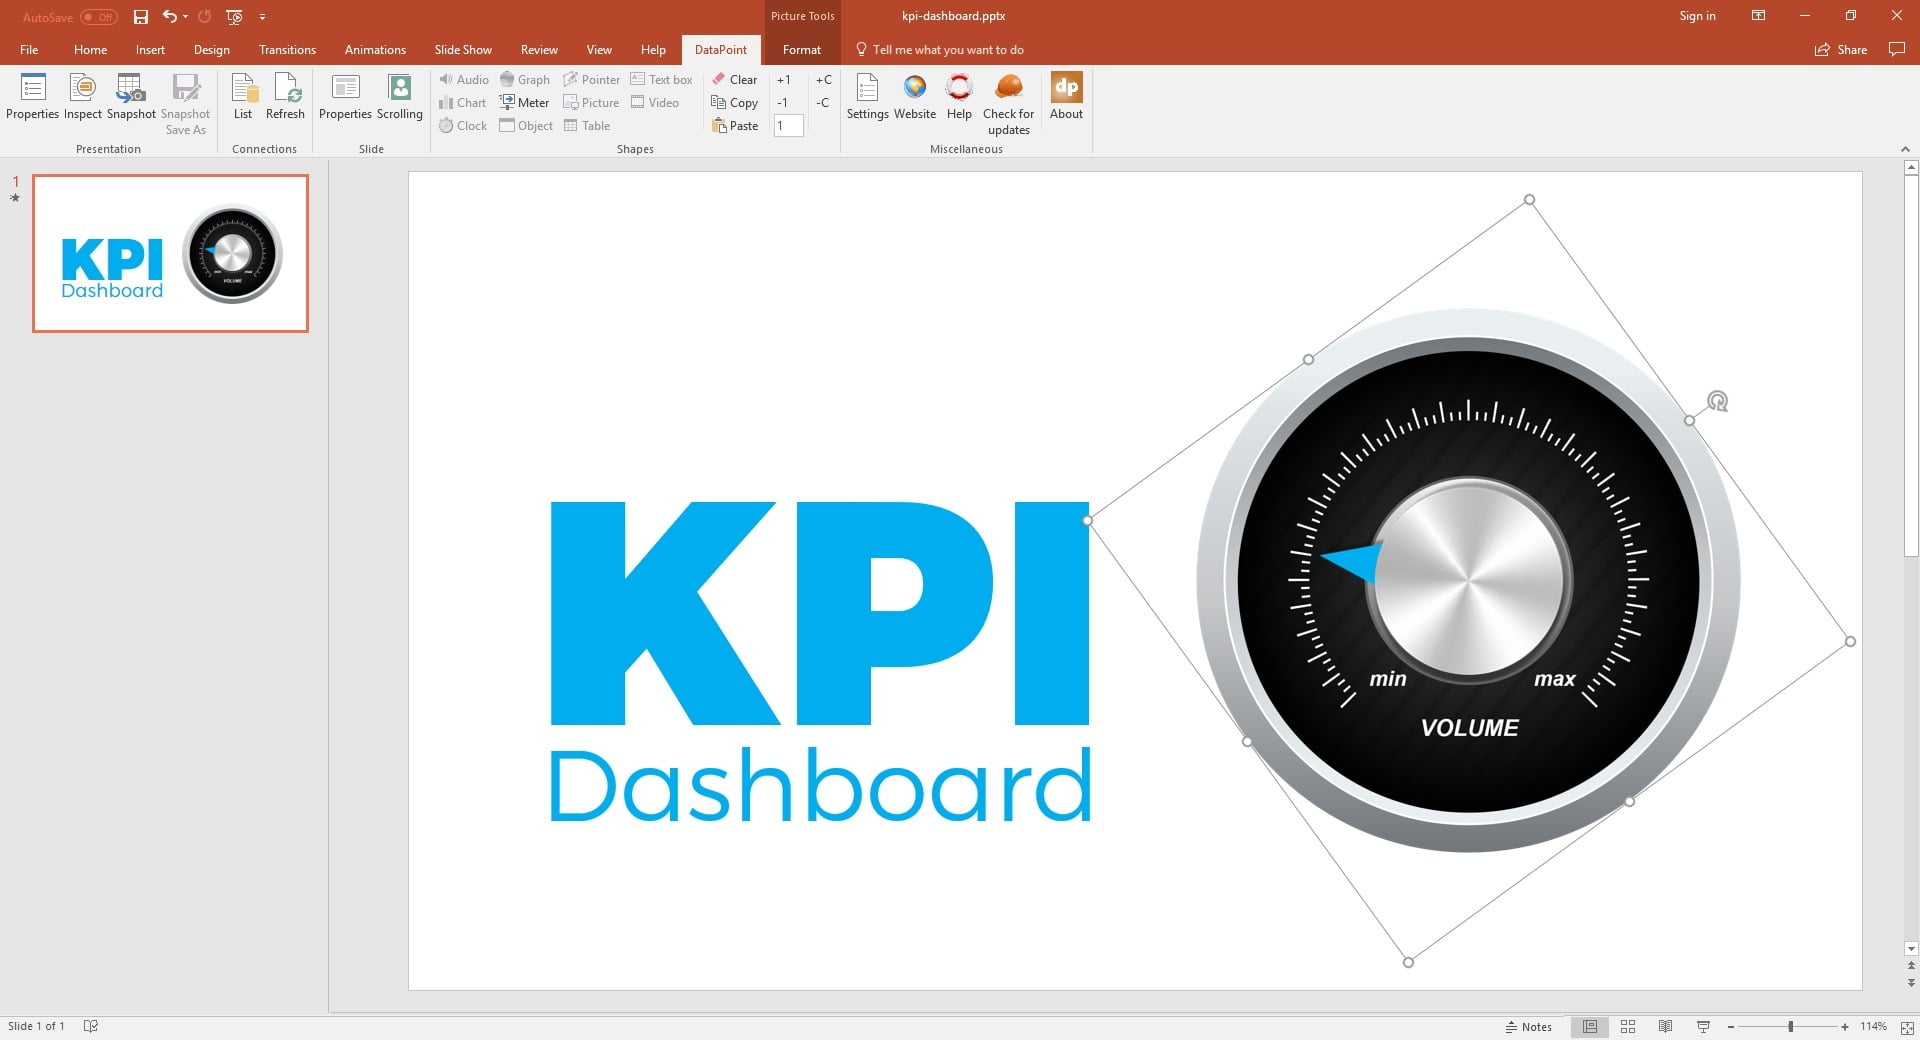
Here we have a simple Microsoft PowerPoint presentation. For the gauge, we physically have 2 images. Image A for the gauge itself and this serves as background and the scale. The second image B is only the needle that we are going to rotate dynamically based on the Excel value we have.
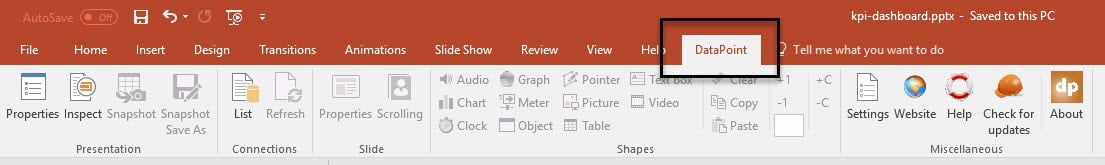
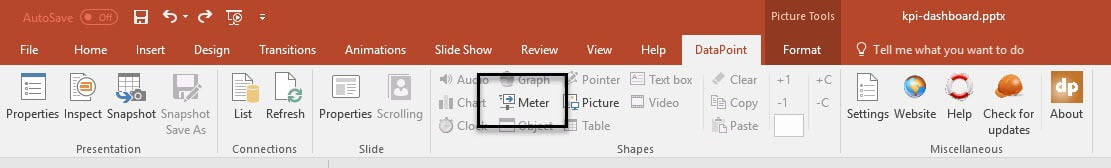
At the PowerPoint ribbon, you will find a DataPoint option.
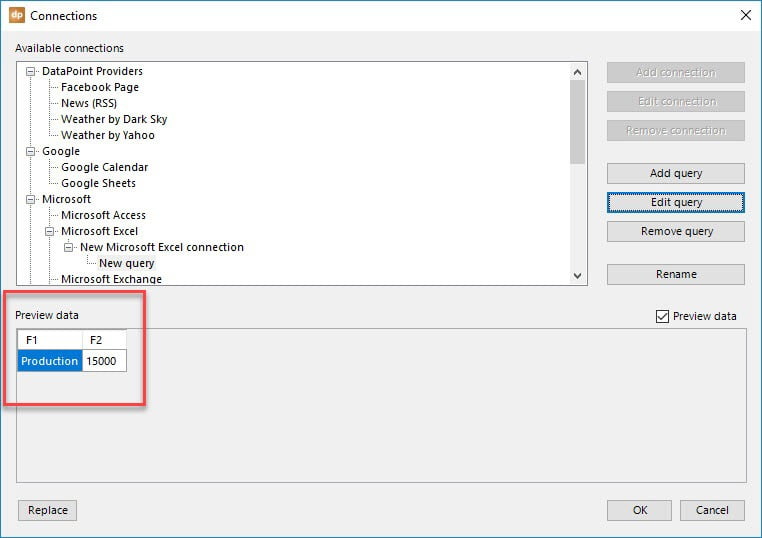
Click on it to open its functions. Next click the List button of the Connections group. From the list of data providers, navigate to the Microsoft Excel node and click the Add connection button.
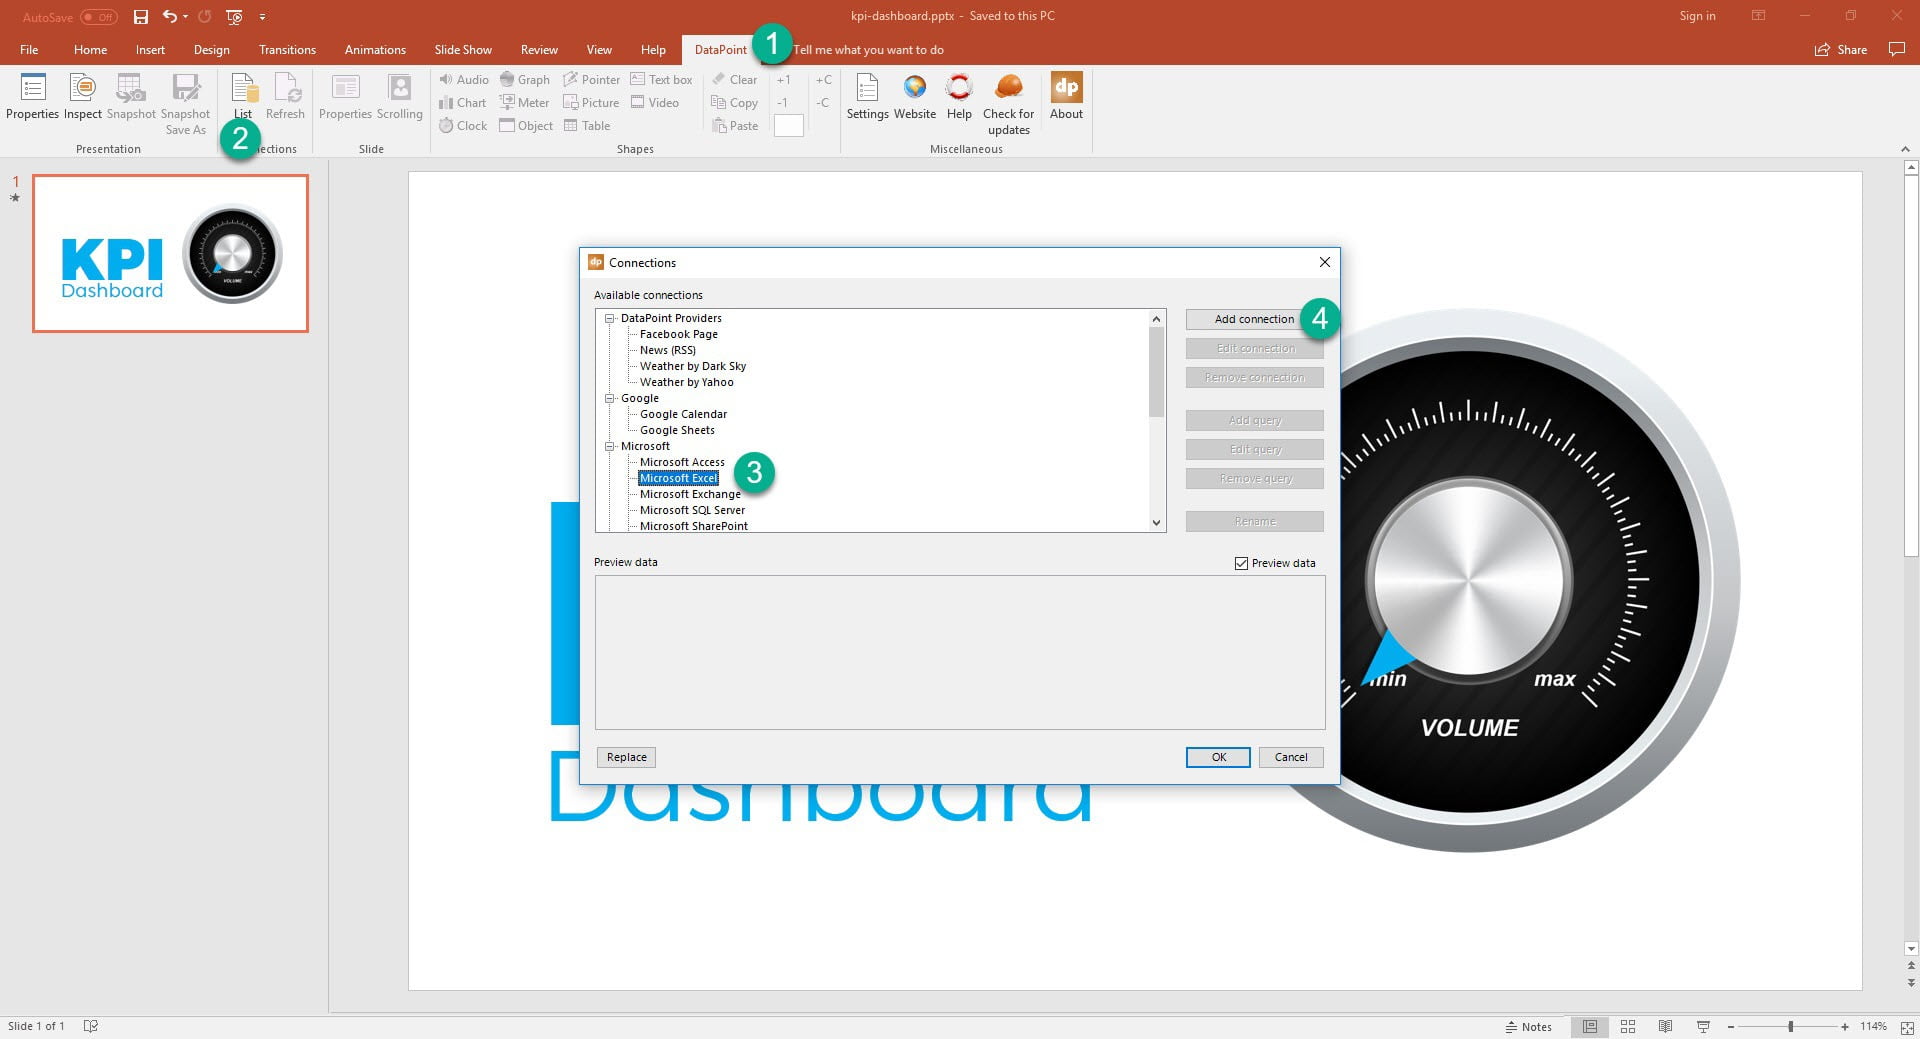
Browse to your Excel file and return to the overview. Next click the Add query button.
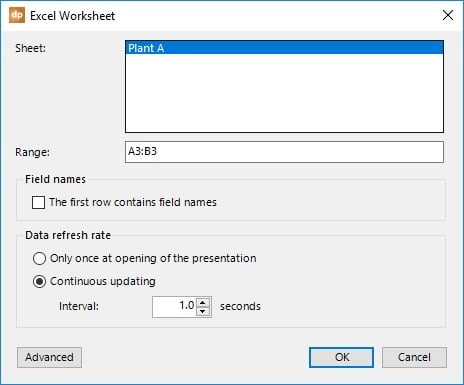
Select the sheet and set the data range to A3:B3. Set the refresh rate to a value you would like to use. Set it to 1 seconds for critial and fast updating values. Use a higher value for less critical data.
Hit OK to close and you will see a preview of the data. That column named F2 with a value of 15,000 is something that we want to show on the gauge.
Select the needle image (image B as it was named earlier) and rotate the needle itself to a minimum position on your scale. Then click the Meter buttom from the DataPoint ribbon.
Select the data connection and set the corresponding data column. Here set it to use the F2 column of row 1. You will see that value of 15000 at the preview.
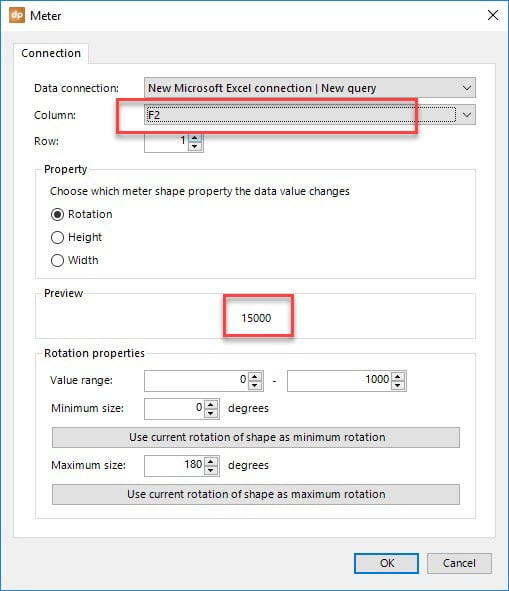
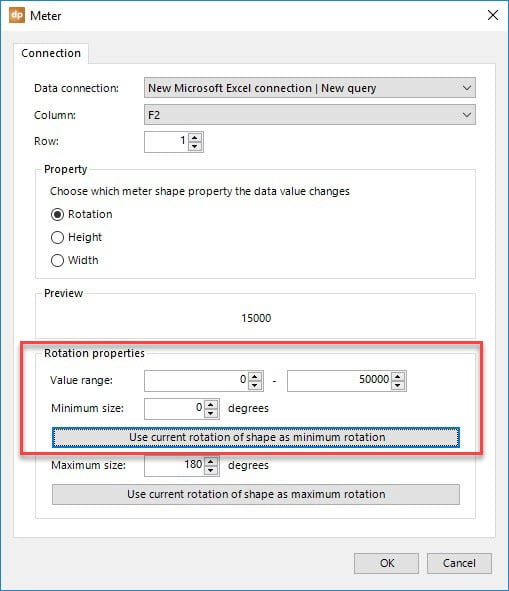
At the rotation properties group, set the value range. Set the minimum and maximum value as it can be found at the data source and how it is represented on the gauge scale. Below at the screenshot, we use a minimum value of 0 and and maximum value of 50,000 units.
Remember that the needle was rotated to the minimum position of the scale. Click the Use current rotation of shape as minimum rotation or set the degrees manually at the Minimum size box.
Click OK to close and the current value of 15,000 will somewhat be applied to the meter shape.
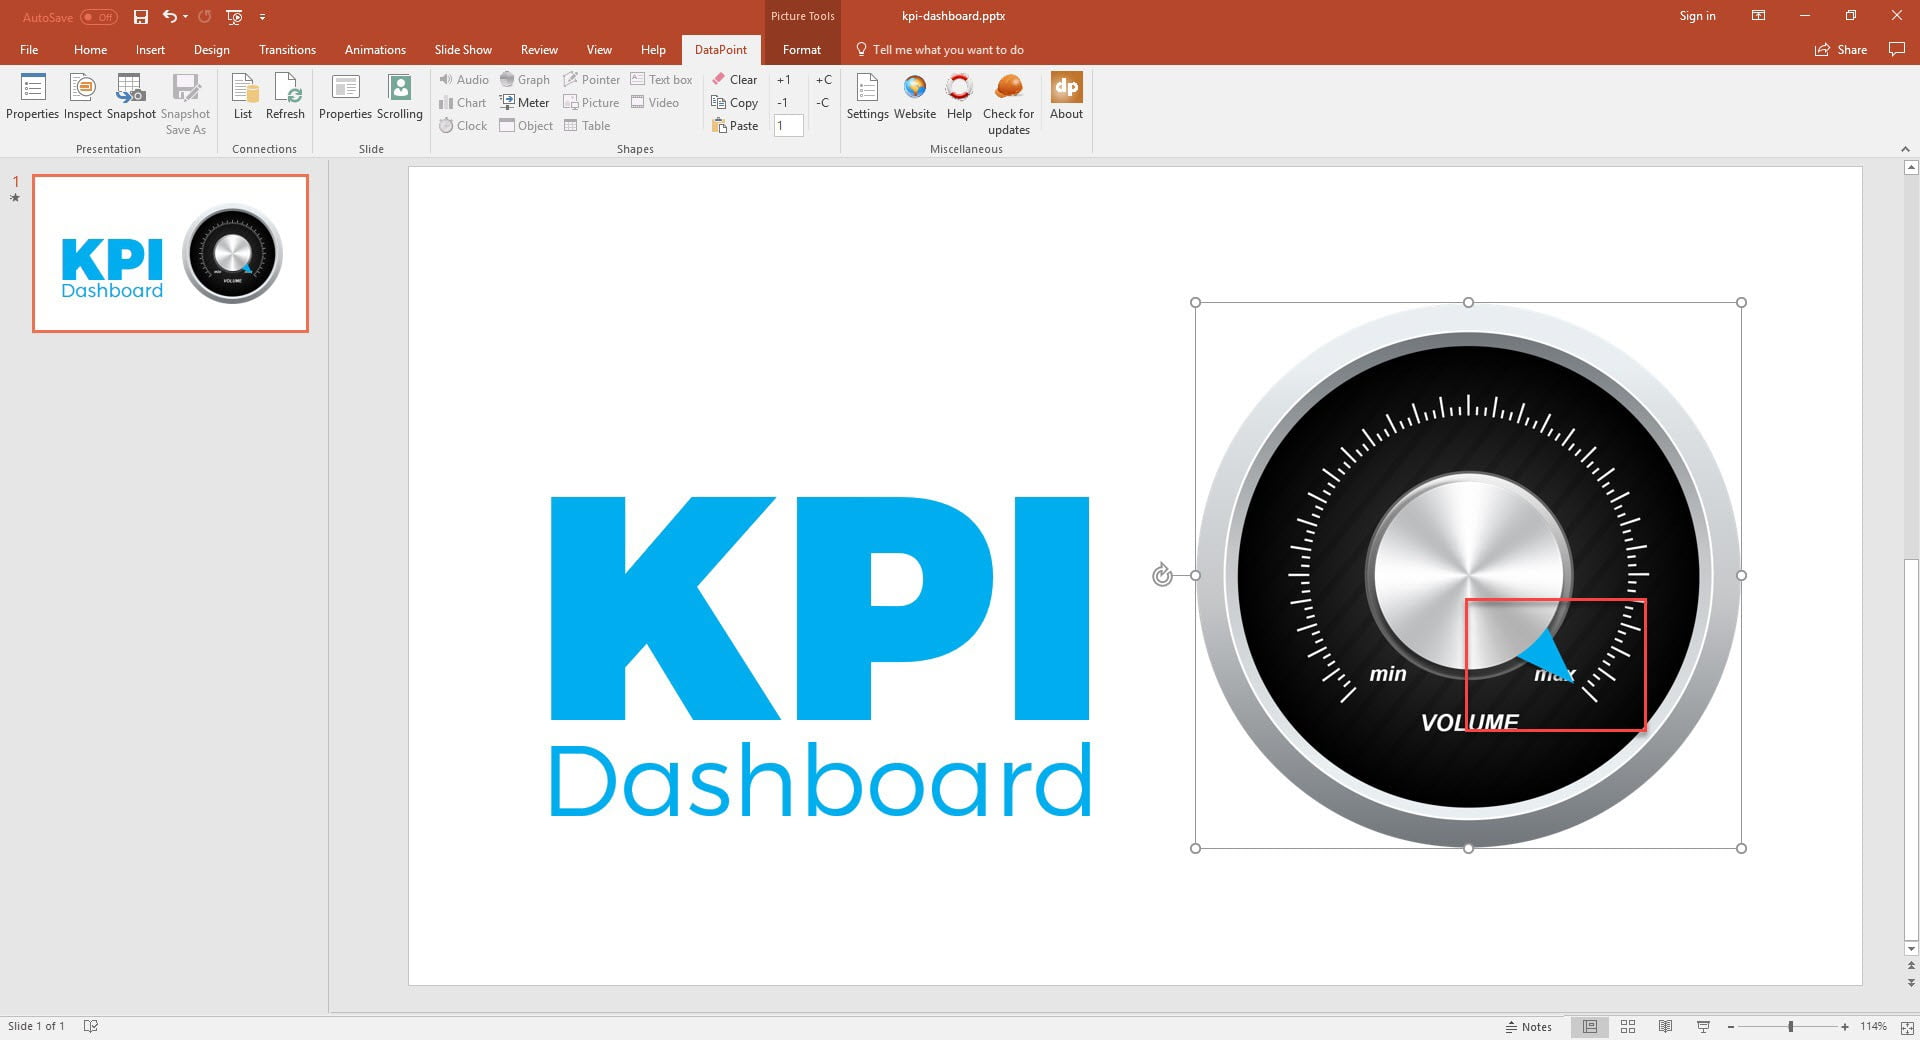
Now select the needle again and rotate it to the maximum position, as below.
Then click the Meter button again to go back into the properties.
Click the button named Use current rotation of shape as maximum rotation or set its value manually.
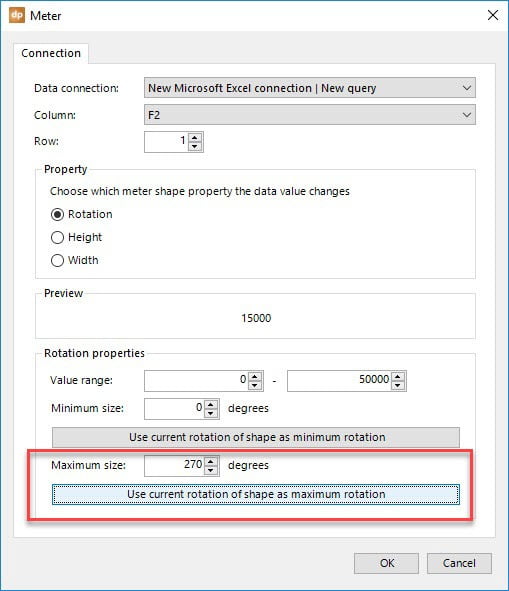
All possible information is set now. We have a given dynamic value of 15,000. We have set the minumum and maximum rotation of the needle, being 270 degrees rotation in total. And we have specified that the dynamic database value is a value between 0 and 50,000.
So we have all information to project that 15,000 value on the scale of 270 degrees. A dynamic value of 0, would point our needle directly to the minimum rotation value. The maximum dynamic value of 50,000 units, would set the rotation to the maximum rotation of 270 degrees. The current value of 15,000 units, would point to somewhat 1/3 of the scale.
Click OK to close the meter properties form.

You can save the PowerPoint dashboard presentation and run it as a slide show. Don’t forget to set the slide show type to kiosk mode for continuous looping. You can move your Excel file on a network share and update it from there. In case that you physically move the file to another location, remember to change the path pointing to the Excel file.
Open the Excel and update your value. DataPoint will update the needle in real-time to inform your customers or to motivate and inform your personnel about sales or production.
Download your free 15 days trial of DataPoint to get started.
You can download this free PowerPoint dashboard presentation.

