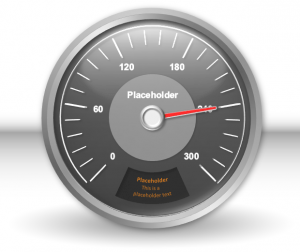
 A car’s dashboard gives you vital up-to-date information about your car’s performance. Similarly, a manufacturing KPI dashboard gives you a visual, at-a-glance method, of monitoring your manufacturing Key Performance Indicators.
There are hundreds of possible manufacturing KPIs you can monitor. Here are a few examples:
- Throughput: This is the amount of product being produced. You can count this by the day, week or by the shift to create friendly competition between employee teams.
- Rejects: This can show the reject rate of the product you are producing.
- Downtime: Shows how much time are you losing due to equipment failures, material shortages, and other factors.
- Safety: Track how many days your workplace is running accident-free.
- Materials Inventory: Track your materials inventory to minimize downtime due to material shortages.
- On-Time Delivery: Tracks the percentage of time that you deliver a completed product to your clients on schedule.
The manufacturing KPIs you choose to measure should reflect your larger goals such as improving quality, customer experience and efficiency. You should focus on a few critical ones rather than a huge number of indicators that have less impact. The KPIs must also be indicators that those in charge can control and that they can train workers to achieve.
The first step to your manufacturing KPI dashboard is to ensure you have all the data you need and can get the updated KPI at a regularly scheduled time. Review your manufacturing software and processes to see where you can generate real-time shop floor data.
Now, look at the format the data is in so we can determine how to get the data onto reporting slides. Our DataPoint tool lets you import a wide range of data types into a PowerPoint presentation you can use to create a manufacturing KPI dashboard. So you can have data from multiple computer and manufacturing systems all in one presentation.
These data formats you can import include:
- Excel
- .CSV files
- JSON
- XML
- MySQL
- Microsoft SQL Server and others
See the full list of data providers.
DataPoint lets you connect these data feeds to your manufacturing KPI dashboard and update it in real time. The results can be expressed in numbers, charts or even in visual art displays like tachometers and infographics.
Not sure how to track one of your manufacturing KPI’s? Contact us and we will be happy to provide an initial consultation.


