
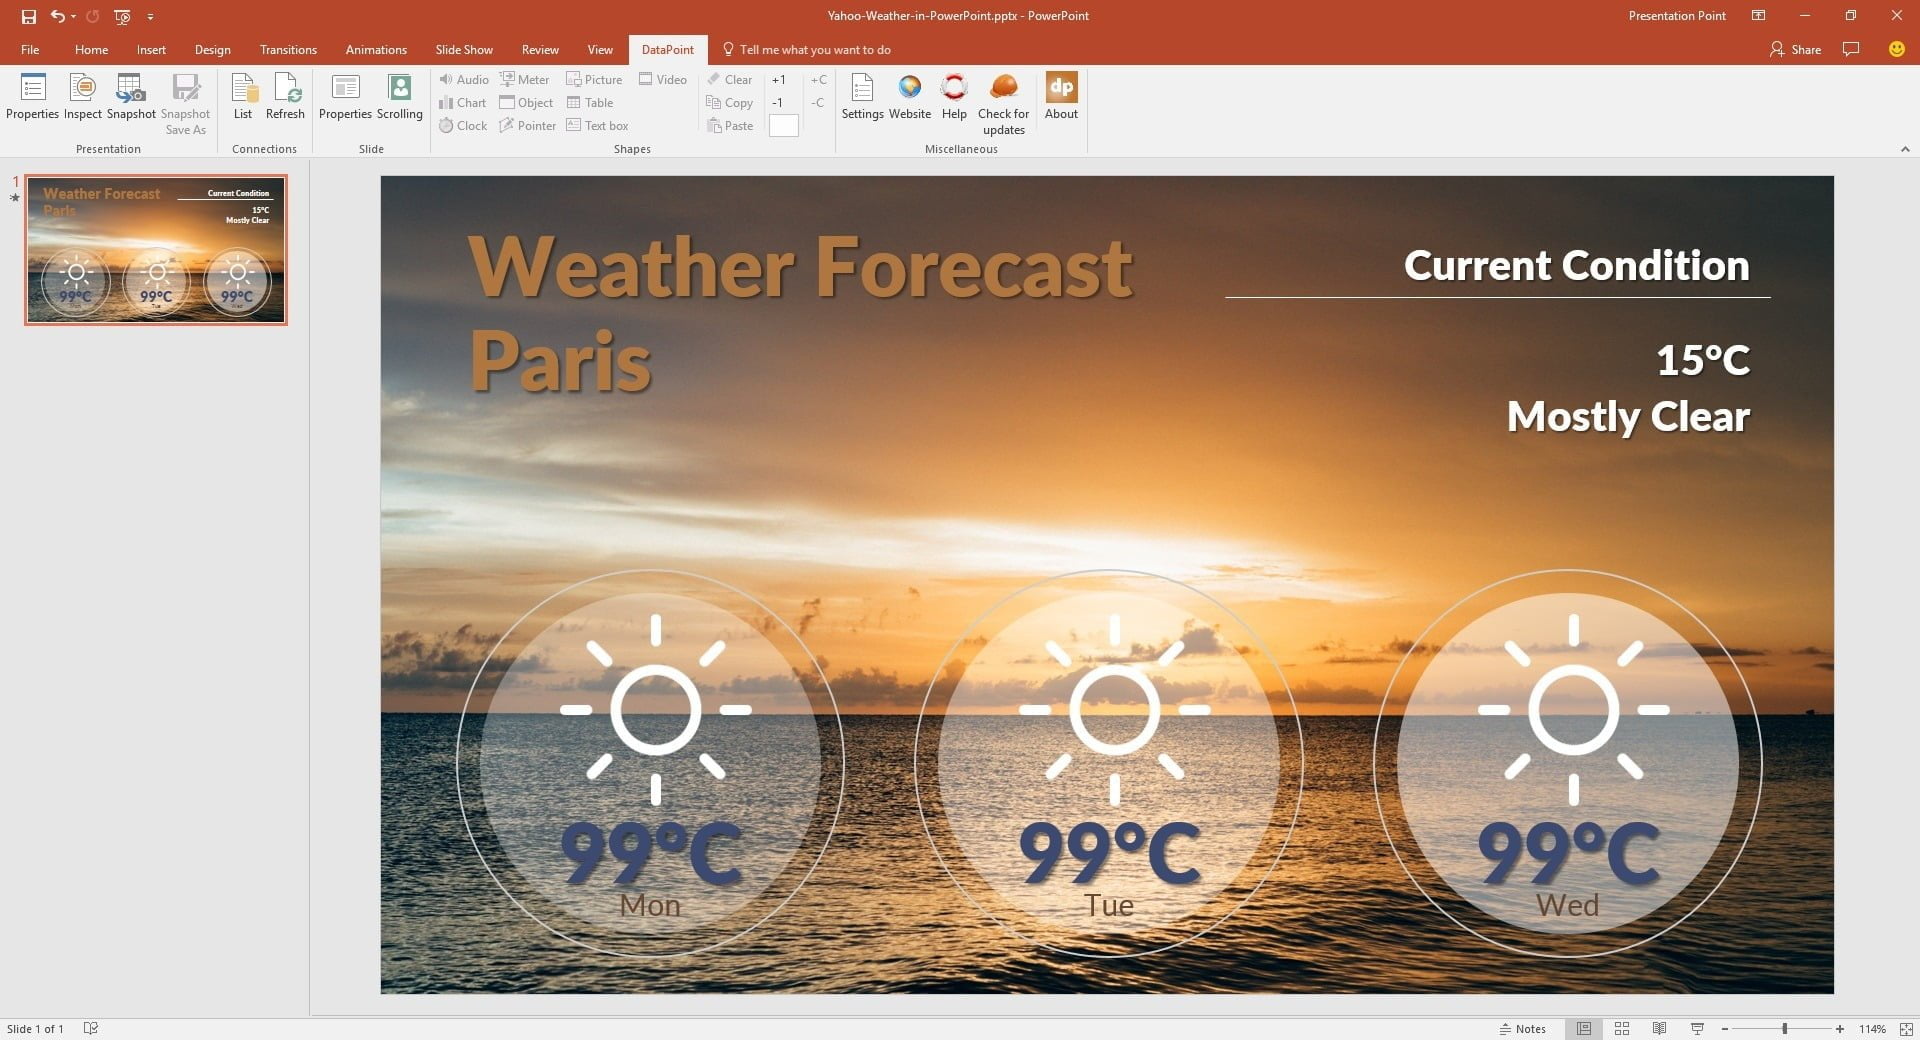
Let’s bring this static PowerPoint presentation to live with real-time weather information. For this article, we will use the Yahoo Weather data provider as we have in our DataPoint for PowerPoint add-on. We will start with this static designed presentation. Look at the text boxes and pictures with static information. We will bind all text boxes to variable information as it is returned by the weather source.

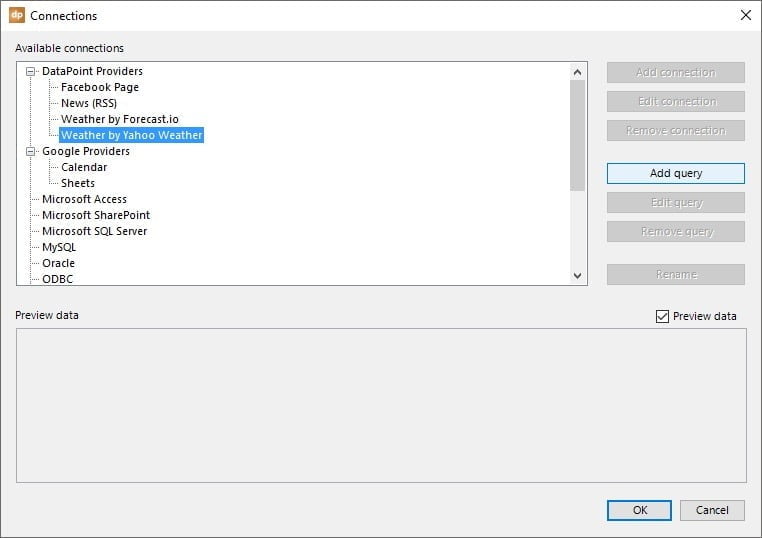
Click to open the DataPoint menu and click the List button of the Connections group.

From the list, select Weather by Yahoo Weather node from the Data Providers list. Click the Add query button.
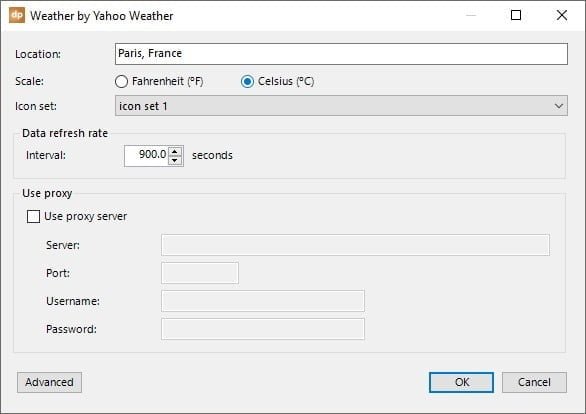
In the location, enter the city and country or city and state to identify the (nearby) city. Choose between Fahrenheit en Celsius.
Choose an icon set. Icon set 1 represents white weather icons for on a darker background. Choose Icon set 2 for black weather icons on a lighter background.
Finally choose a data refresh rate to update the interval.
Click OK to close.
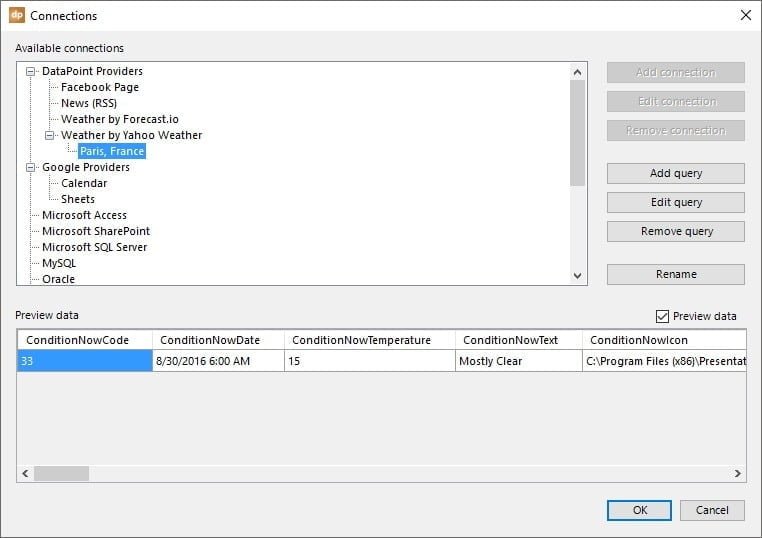
Back on the connection list, we click the Rename button and give the query a meaningful name. And we get to see a preview of the weather data here already. Click OK to close.
Select the location text box and click the Text box button of the DataPoint menu.
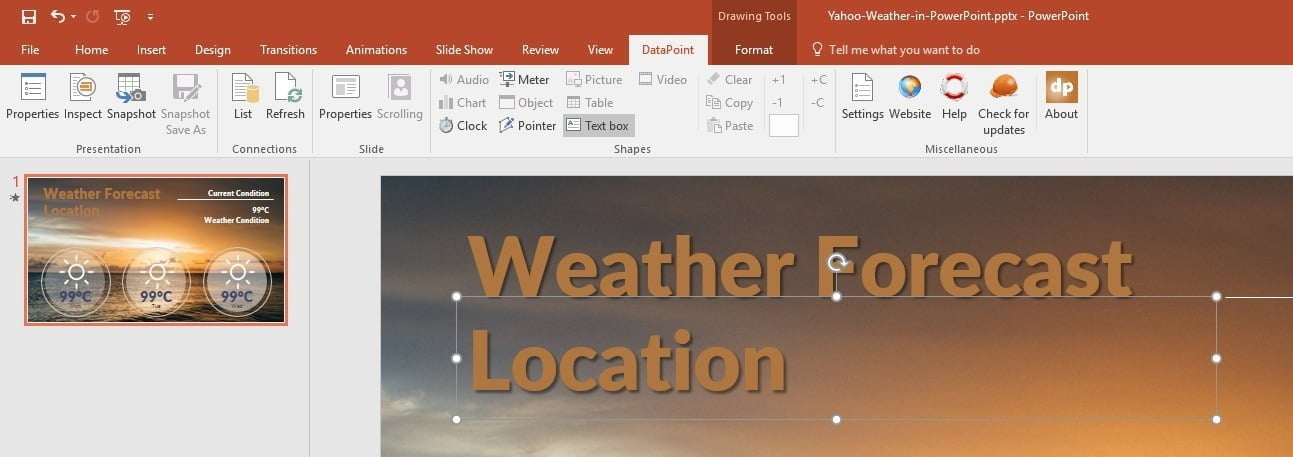
In the binding options, use the first and default data connection. Select the column named LocationCity from the list of columns. Leave the row number at 1. You will see a preview of the value here, Paris. Click OK when you are ready.

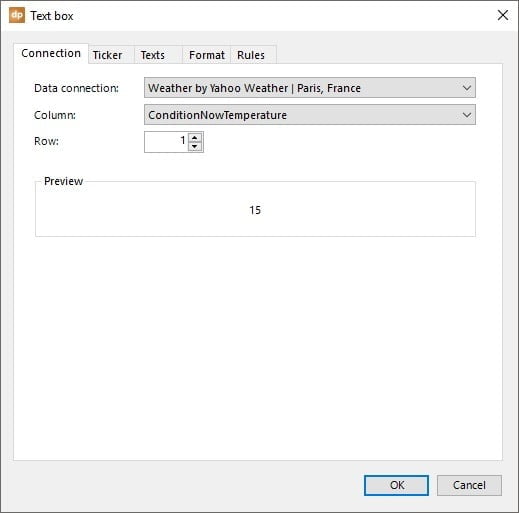
We will do the same for the current temperature. Select the text box to host the current temperature and click the DataPoint Text box button again.
Same data connection and row number as before, but in the column we will select ConditionNowTemperature.
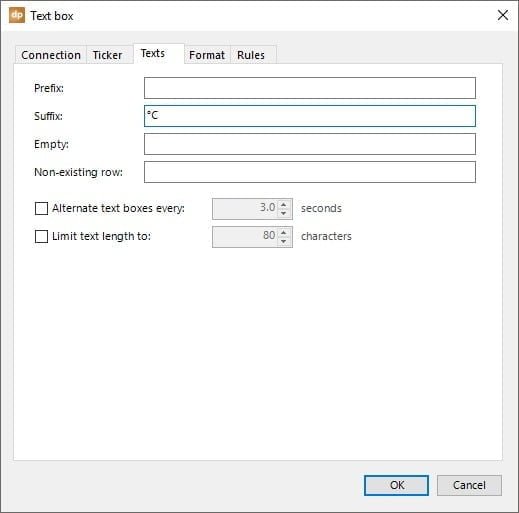
The value of the current temperature is just a number. When we display this, we want to add the degree sign and F for Fahrenheit or C for Celsius to the number. Click to open the Texts tab. At the suffix option, enter “°C” for the Celsius temperature of Paris.
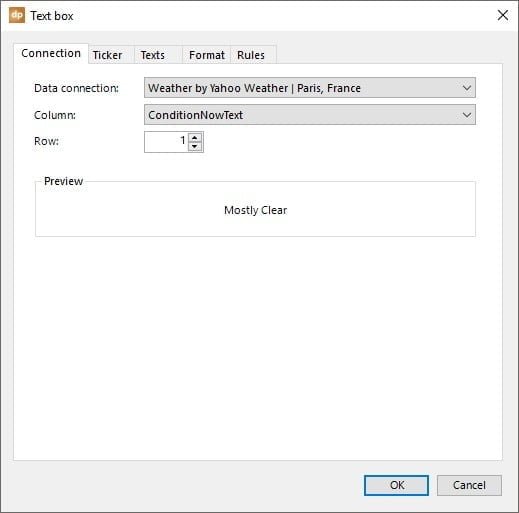
Select another text box to host the condition text and click the Text box button again.
Link to the column named ConditionNowText and hit OK.
So far we are on our slide.
Select a picture to show the weather icon for the next day. Click the Picture button.
DataPoint will ask to convert this normal PowerPoint picture into a dynamic picture. Click Yes to confirm.

In the picture properties, use the default data connection. In the column, choose ConditionD1Icon from the list, and leave the row number at 1. Click OK to close.
The group of columns with D1 represents the weather forecast information of today plus one day, so tomorrow. D2 contains the information for the day after tomorrow. D3 contains the information of 2 days after tomorrow.
Link the other shapes to complete the slide. Set all weather icons for the 3 future days, the maximum temperatures and the name of the days.
Run the slide show and DataPoint will continuously update the information on all slides.


thats so nice
In your example of 99º C, everyone would be dead, just sayin’
Correct remark, but here that 99°C is just a placeholder for a number with 2 digits, before it is linked.
I can’t get the photo to convert to the icon. Says system cannot find the path specified
Dear Adam, not sure why. Icons are installed with DataPoint and DataPoint is taking care of the path. Best to create a trouble ticket at https://presentationpoint.com/support/ and send in some screenshots.
And you should be using the latest version of DP and use the new DataPoint weather provider since the Yahoo Weather API retired.