 Different currencies are used worldwide for business and travel. When you do business with another country you might have to deal with a different currency that you are used to use in your own country. To estimate a value you need to know the current exchange rate between 2 currencies. For example when an American citizen is visiting Europe, then he needs to know the exchange rate between US Dollars and Euros. What will he get in Europe with his 100 USD note?
The exchange rate is often displayed on information screens at airports, exchange offices, banks, tourist information desks etc. The user can use an old fashioned letter board to display the exchange rate. So each morning you have to make a phone call or consult a website to find out what the current exchange rate is. Then update the letter board and use the right digits forming the current value.
But over the last years, the letter boards are replaced by a television screen or monitor connected to a computer that is running a presentation. And when the user think about a presentation, the user will say PowerPoint. So still, when the user had an update every morning, the user needs to stop the running slide show, edit the exchange rate in a text box, save the presentation and start the slide show all over. That is not a professional way of working because the user still can make a mistake by switching 2 digits and interrupt the running slide show which is visible to the customers, or the exchange rate needs to be updated more often than just one time in the morning. Then it would be handy when the user could automate this simple updating, without mistakes, without interruption. There are tools on the market that allows the user to collect information from a database or web service and then display this information in real time to the running PowerPoint slide show. PresentationPoint’s DataPoint addon will do that for the user. Let me show how DataPoint adds a menu option to the PowerPoint menu.

Now when clicking on the DataPoint option the user will get more DataPoint menu options. First click List in the Connections group.

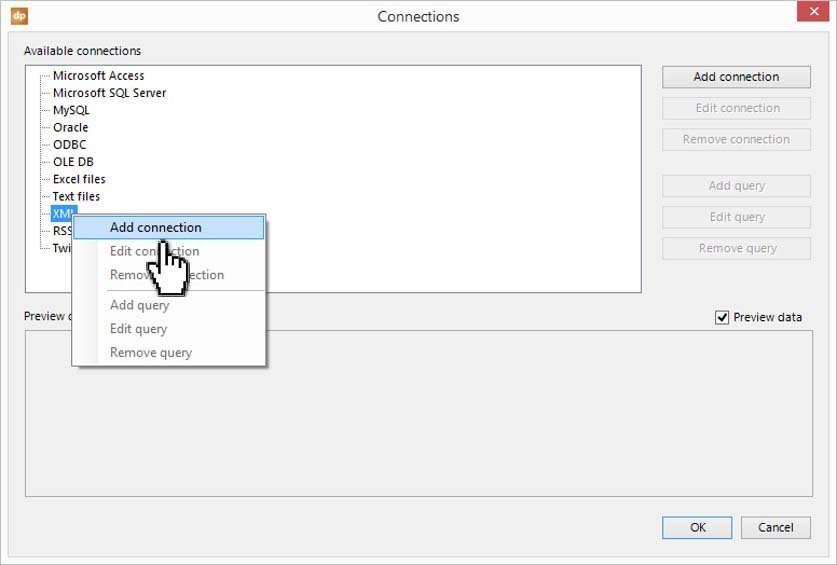
So first we have to set up a connection to an external web service that is providing exchange rates electronically. An example site that we use here is the European Bank. They have a free RSS feed that we can use in DataPoint. RSS is physically a XML structure that is typically used for newspapers and normal web sites to publish the last 20 articles of their site. RSS feeds without the structure to list the latest news – like this exchange rate here – is best handled as a native XML connection because then we have more options to display. Navigate to the XML node in the tree. Right click XML and choose Add connection from the popup menu or use the Add connection button directly.
In the File text box enter the following address http://www.ecb.europa.eu/rss/fxref-usd.html and click OK.

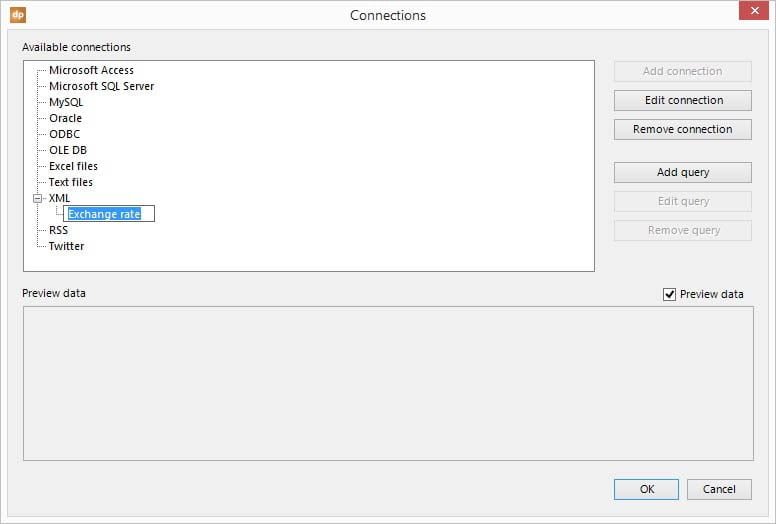
Now we see that the XML connection is added to the XML node. Click on the New XML connection item and the user will be able to change the name. Change the name to Exchange rate like here in the screenshot.
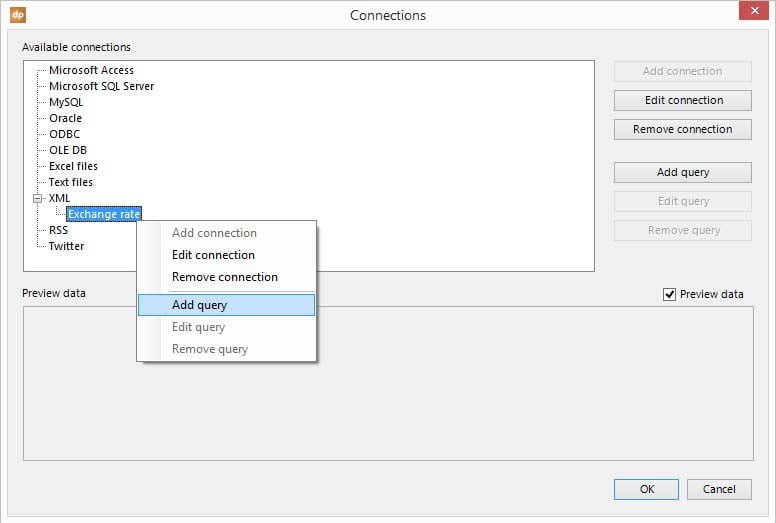
OK, now we have a connection to the European Bank. The XML content contains multiple tables with various information. We are interested only in the exchange rate itself. This value is written into the Value table. So we need to add this Value table to DataPoint. Right click the Exchange rate node and choose Add query from the list.
Select the Value table from the list like this.
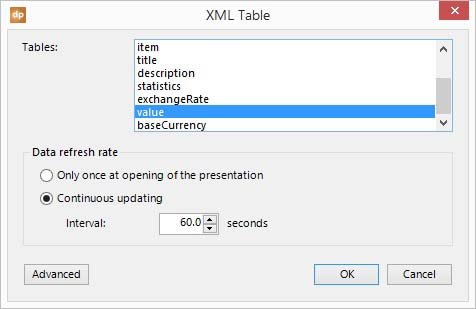
On the screenshot the user will see that the default refresh rate is set to continuous updating every 60 seconds. So when the presentation is running as a slide show then DataPoint will visit every 60 seconds the web service to find out if there is a new exchange rate published. Click OK to apply the changes. At the connections list the user will see that a new query is added and the user will see a preview of its content. If the user can give that query a proper name like Value. Click on the node to enable the renaming.
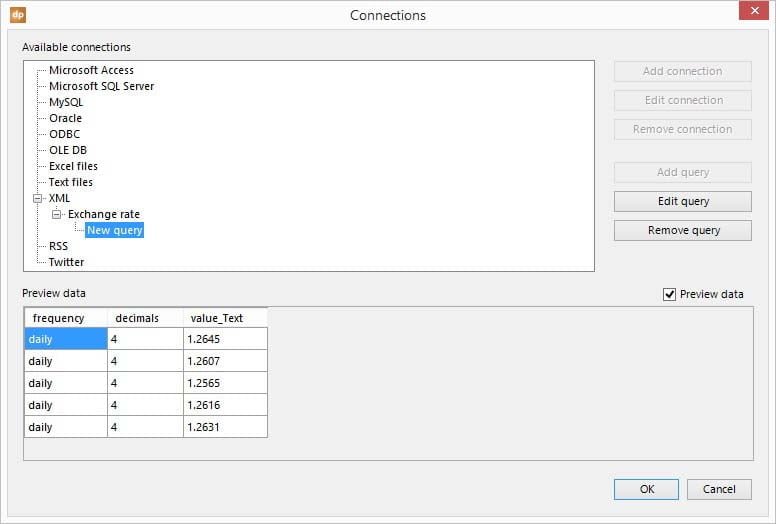
Visually we have not done anything to our presentation yet. We have just set up a real time data connection to a data provider in this PowerPoint presentation. Now we start using this data on our slides. Add a new slide to the presentation (or use the current default slide when it exists). First we will add a new text box to the slide (or again use the default text box when it exists already on the slide) that will serve as a placeholder for our currency exchange rate. With this text box selected, now click DataPoint and choose Text box from the Shapes group. Now we see the DataPoint options that we can set for this text box.
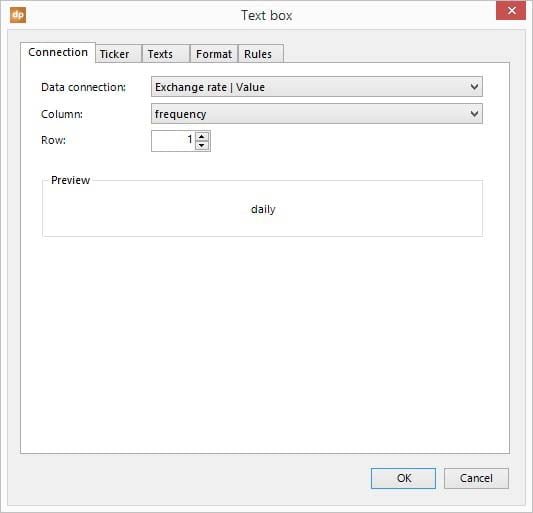
The default data connection that is selected is fine because we only have one data connection in our connections list. So move on to the Column. Here we select the value_Text column from the column list. Row 1 as default is fine too because we use the information of the first row of the data table. In the preview section we can see the actual value that will be applied to the text box. Click OK to apply.
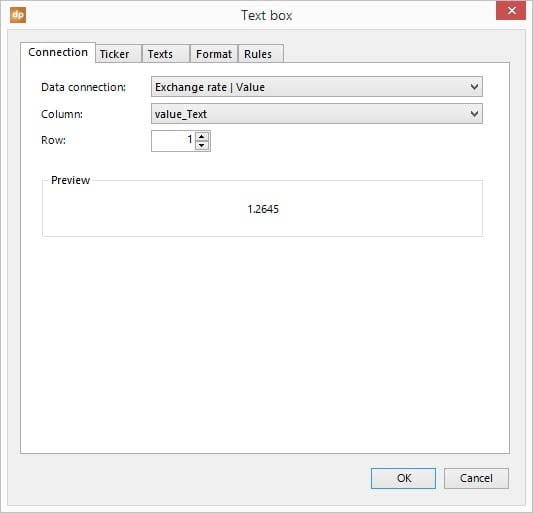
The value of the value_Text column of the first row of our connection is placed as text in the text box.
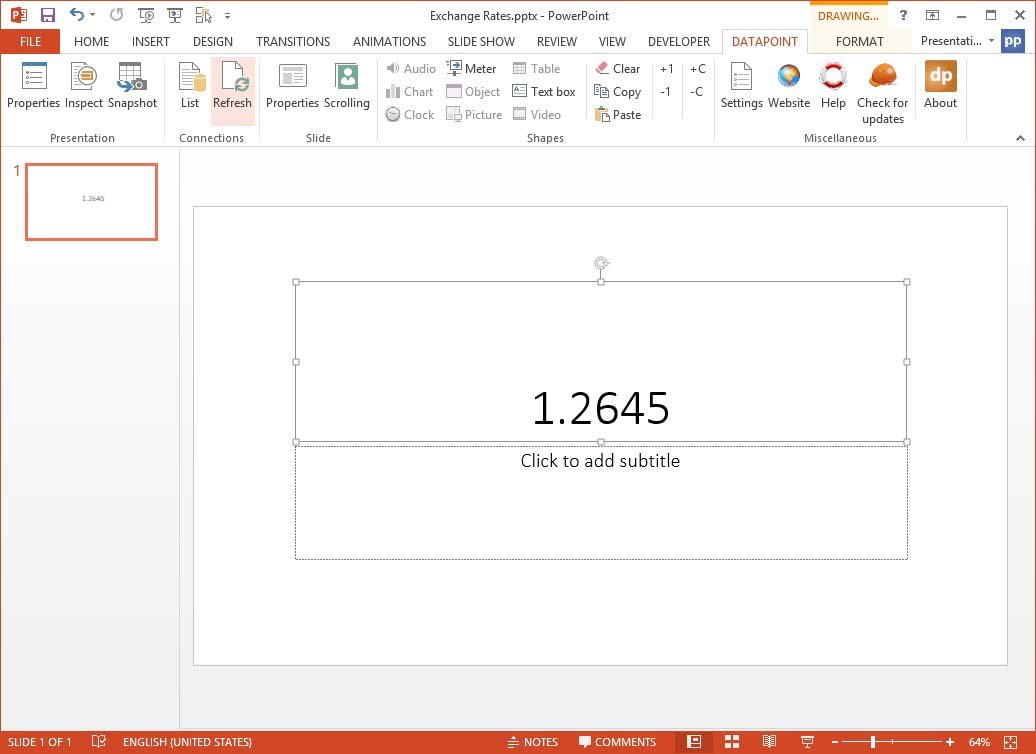
Now all work for DataPoint is done. The user is now successfully connected the presentation to an XML data source and a text box linked to a given column. When the user starts the presentation as a slide show then at opening time DataPoint will visit the data source and get the current value. Then – while the slide show is running – it will check for data updates and change the content of the text box when a new value is detected. So rests only the further customization of the presentation. The user can add more texts and some graphics to this slide. The user can also add other slides to the presentation with more and other information like the opening hours of the bank, or just advertising for the other products and services that the user sells.
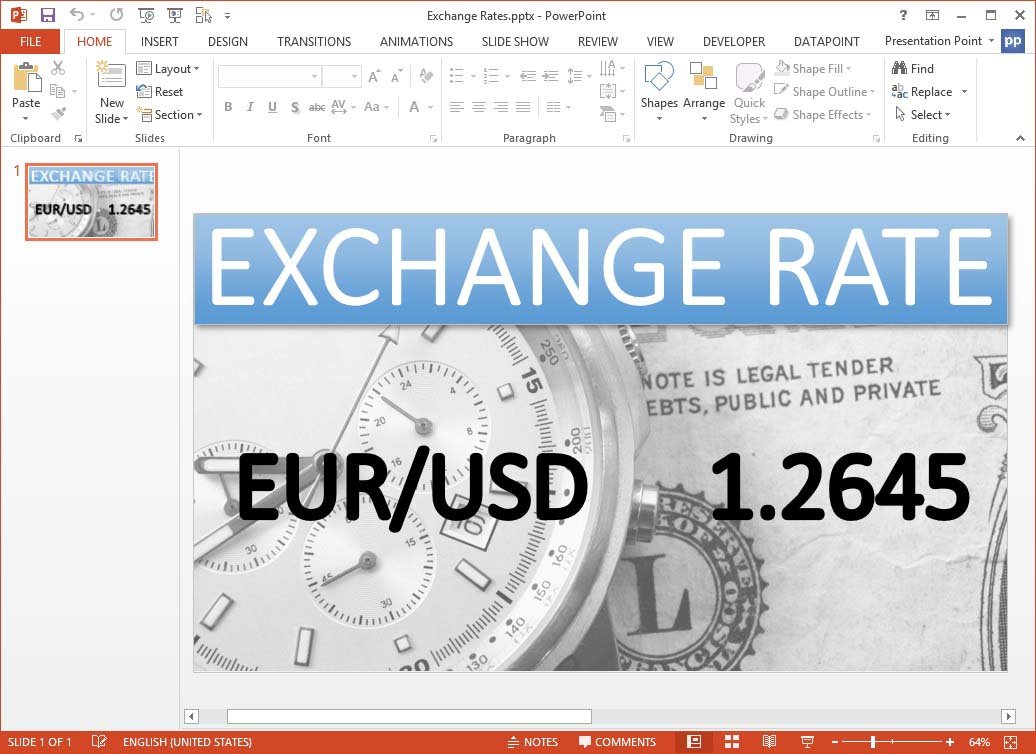
Download DataPoint from the PresentationPoint web site and the user can download this DataPoint enabled presentation of this article with live currency exchange values.


