 Sometimes you want to display live information in a PowerPoint presentation. Maybe you need to display scores or results in real time to people on a television screen. A manager needs to see production figures of a factory at his desk. People on the floor need to know their targets etc. This can be accomplished with data driven presentations.
To display numbers and figures you don’t use a word processor but a spreadsheet like Microsoft Excel. There, the user can enter your raw data and make some simple or complex calculations. Of course the user don’t want to display an Excel sheet on the message boards with its grid lines etc. but the user needs presentation software like Microsoft PowerPoint. PowerPoint is the ideal software for presentations but it is static.
There is a tool DataPoint available that allows the user to create dynamic presentations with live data from Excel worksheets. Some people tend to copy and paste Excel objects in their PowerPoint but that is not done. It will even not update automatically over the network. The user will see the Excel grid lines in a presentation which is not professional looking. The user can use the data only from the Excel worksheet but do the formatting in the PowerPoint presentation. The user can emphasize which text boxes are more important by setting a color, or a more important position on the slide with arrows pointing to this value and some animation. PowerPoint, with its data from Excel, gives more control!
Establish connection
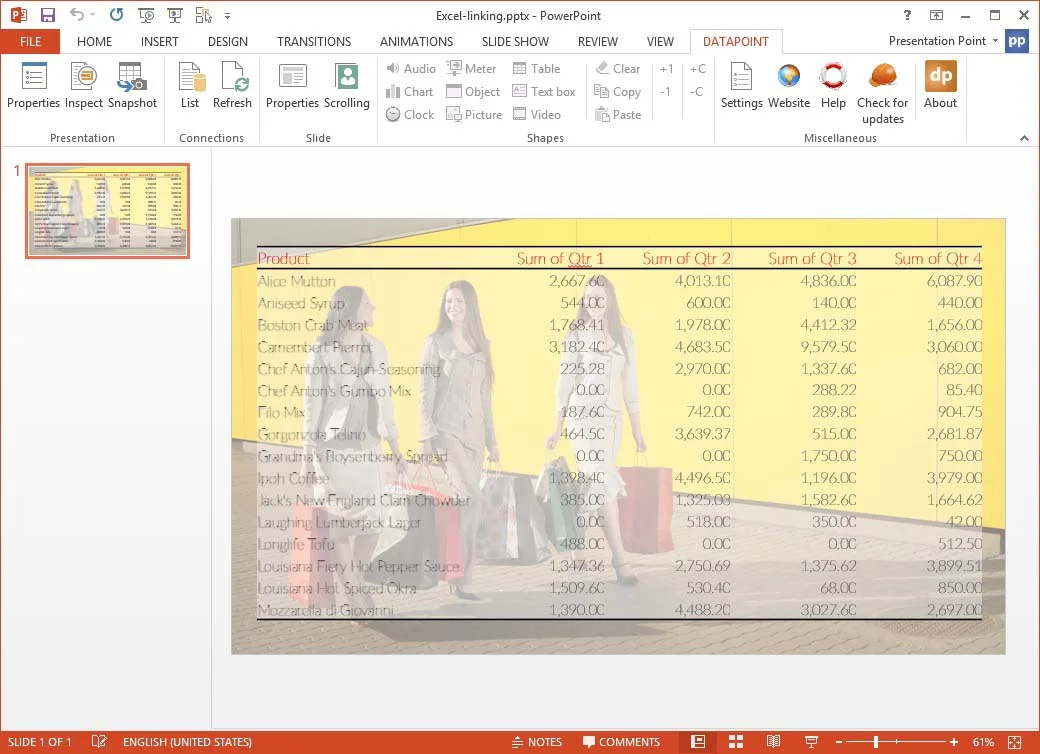
Let me show how easily the user can display live information from an Excel worksheet in a PowerPoint and update in real time. First, the user needs to install DataPoint and then the user will start Microsoft PowerPoint. Click the DataPoint menu in PowerPoint.


Connection to Excel worksheet
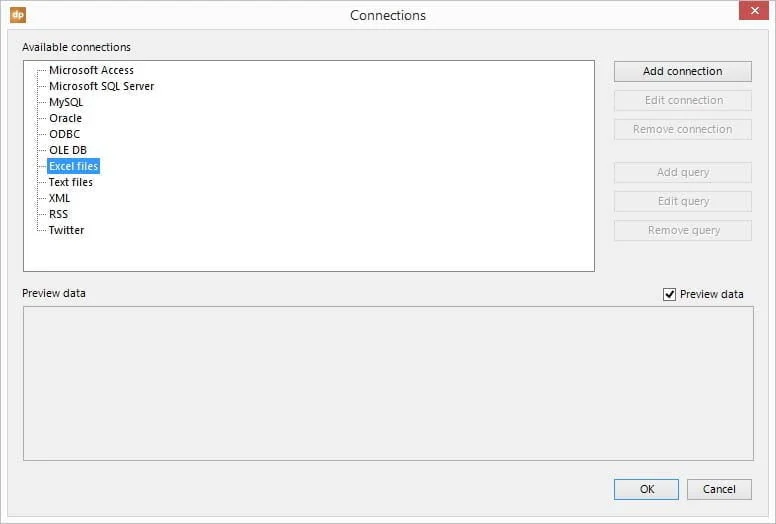
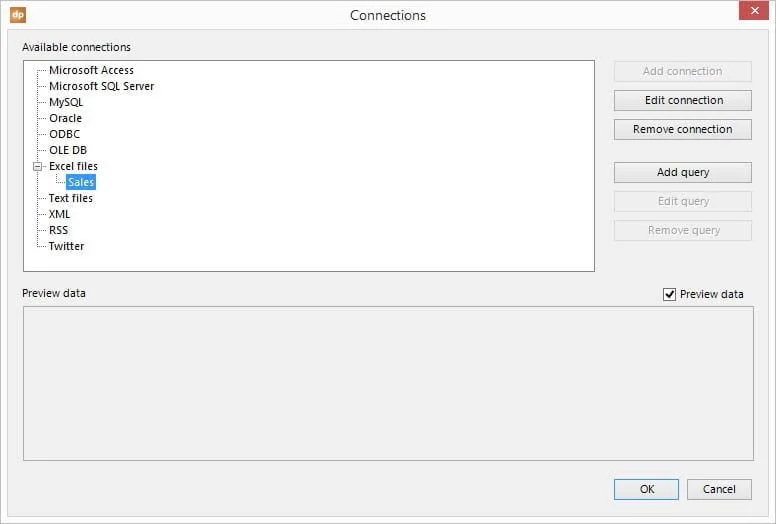
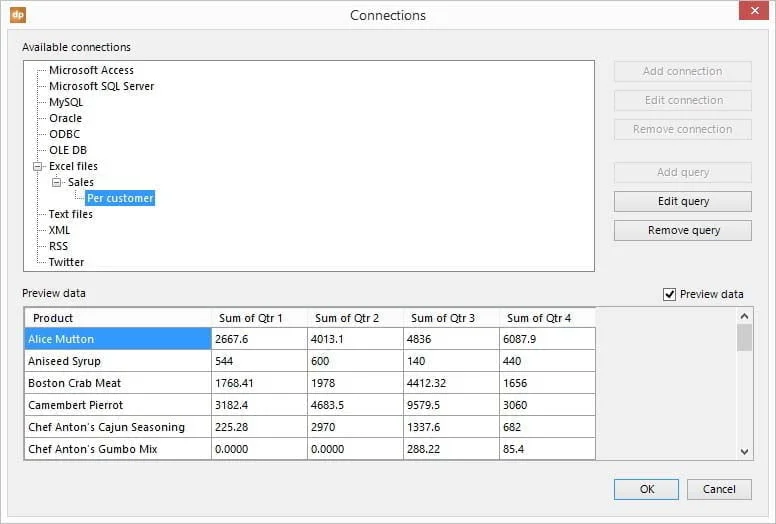
Click Add query in order to connect to a given worksheet and range of the selected Excel spreadsheet.
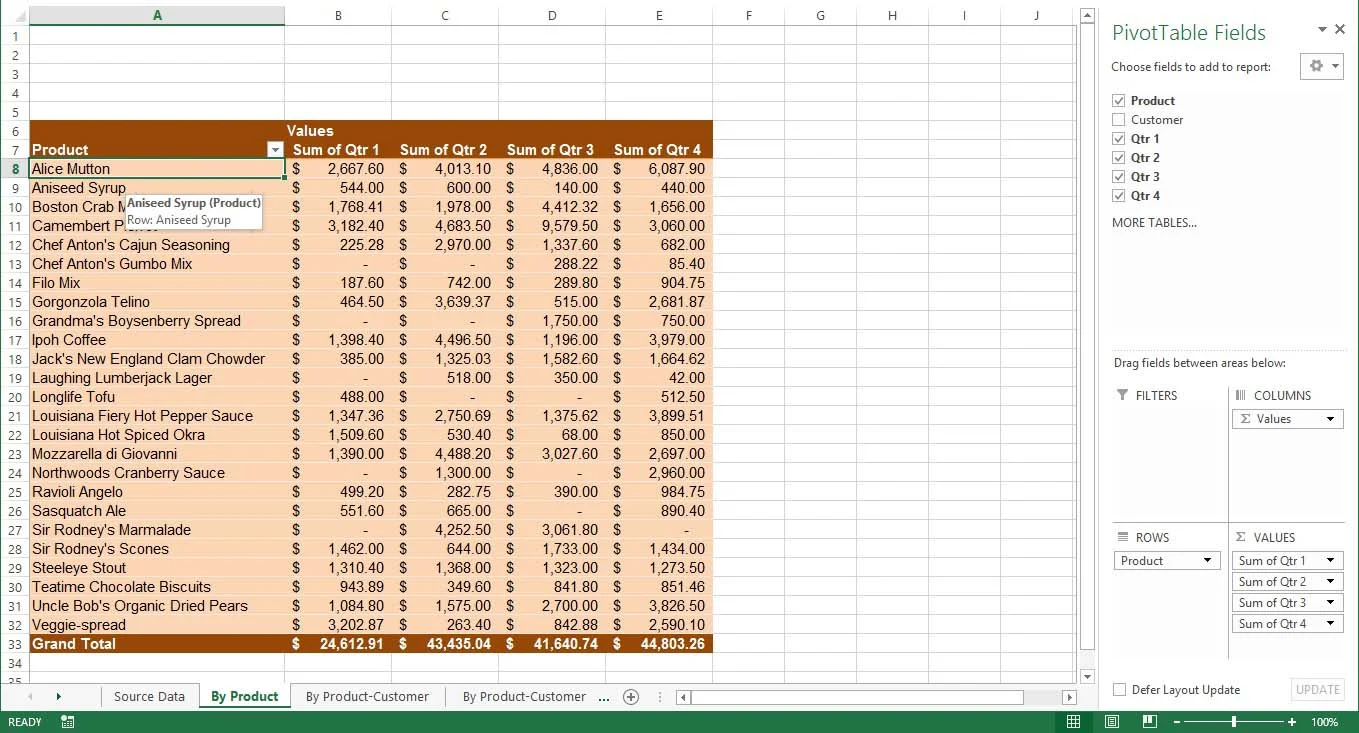
The user will see a list of all the worksheets in the Excel document. For this example select the By Product worksheet.
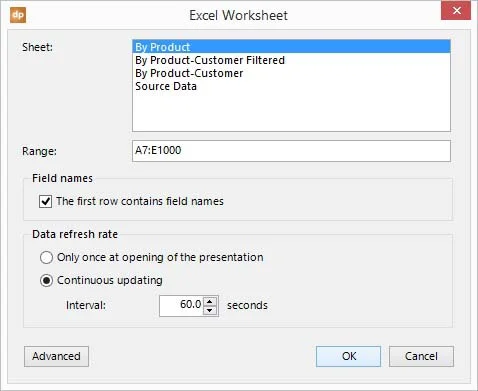
Check the option The first row contains field names. Set the Data refresh rate to Continuous updating with an interval of 60 seconds. Every 60 seconds DataPoint will visit the worksheet and look for data updates.
Click OK to close. Rename the query and the user will see a preview of the Excel data here.
Add table to slide
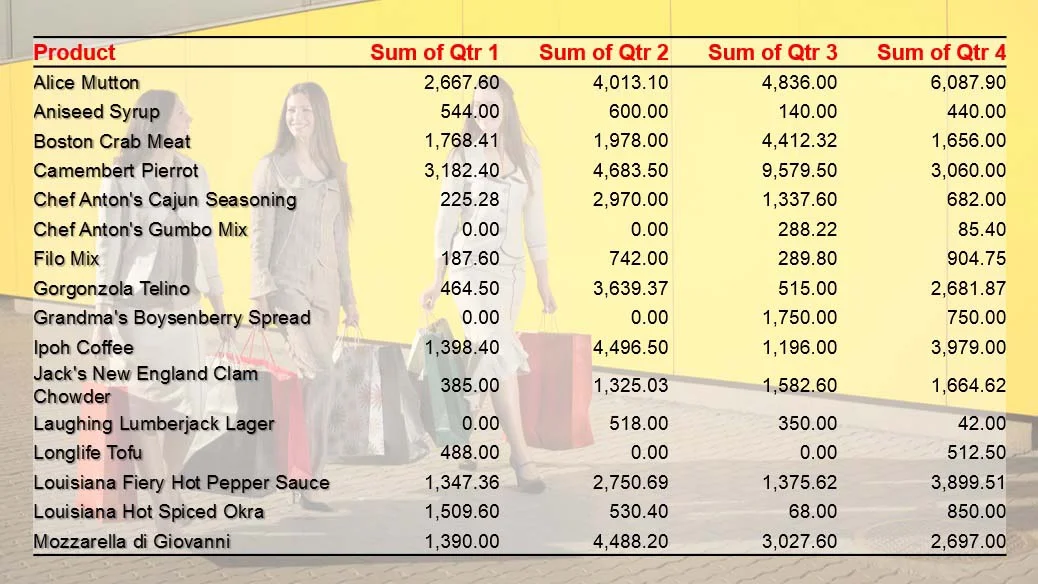
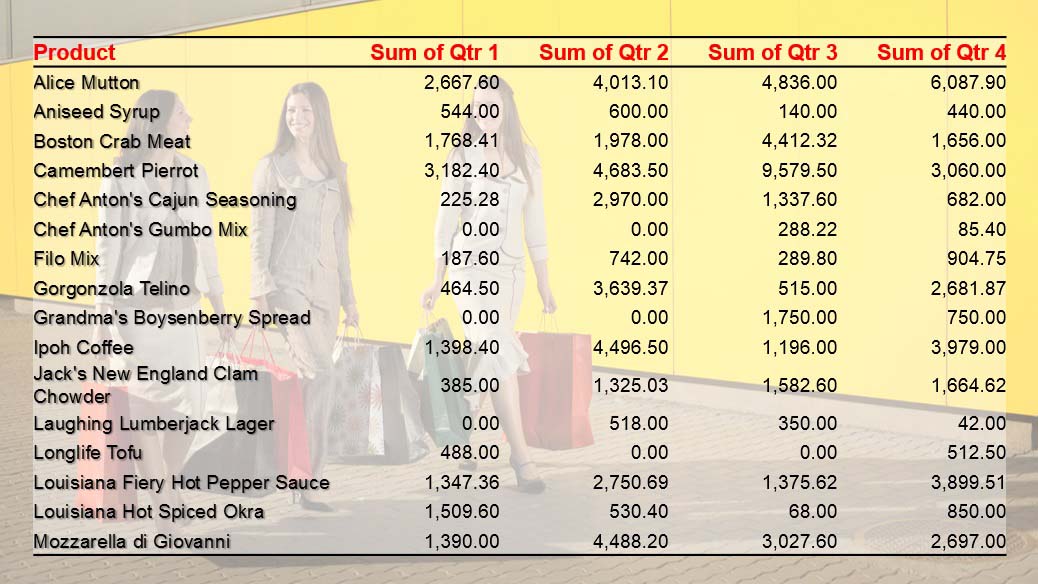
Insert a table on the slide. Take a table with a number of rows and 5 columns. The columns will display the customer’s name and then 4 columns for the quarterly totals.


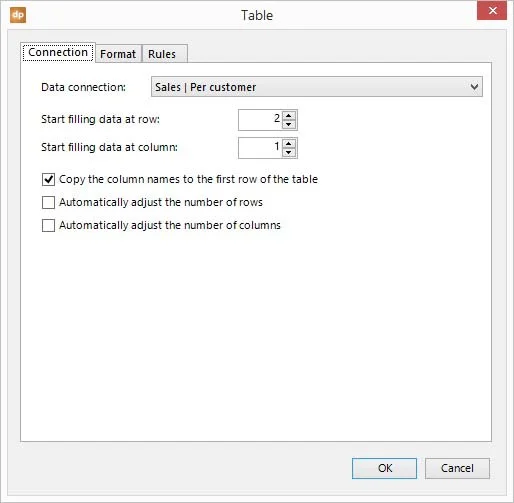
Select all the cells with numeric data. So all cells except for the first column (for the name) and the first row (for the header info). Then click DataPoint and Table again.
Cell formatting
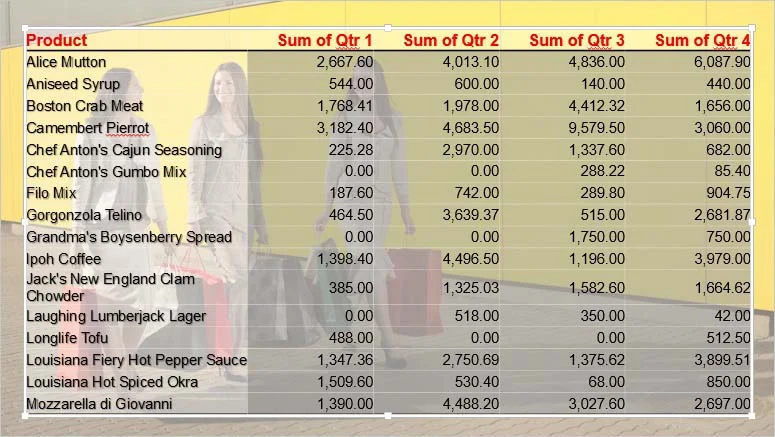
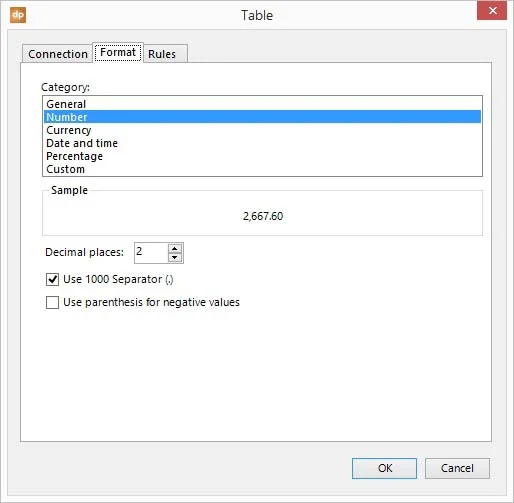
Click to select the Format tab. Set here the formatting to Number. Increase the decimal places to 2 and check Use 1000 separator for these cells. Click OK to close.
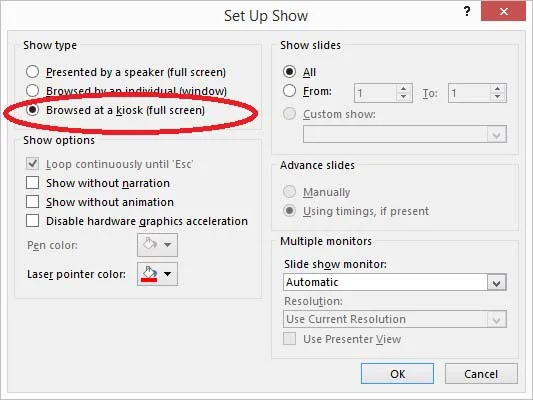
Prepare slide show
Now for the last step, verify that the presentation is set to loop forever since we will display this on a dedicated television or computer screen. Click Set Up Slide Show in the Slide Show menu and make sure that Show Type is set to Browsed at a kiosk.